Login to Ask a Question or Reply
Home › Forums › Chart Support › Displaying multiline chart with label with some data points have no data › Reply To: Displaying multiline chart with label with some data points have no data
April 20, 2021 at 6:33 pm
#34028
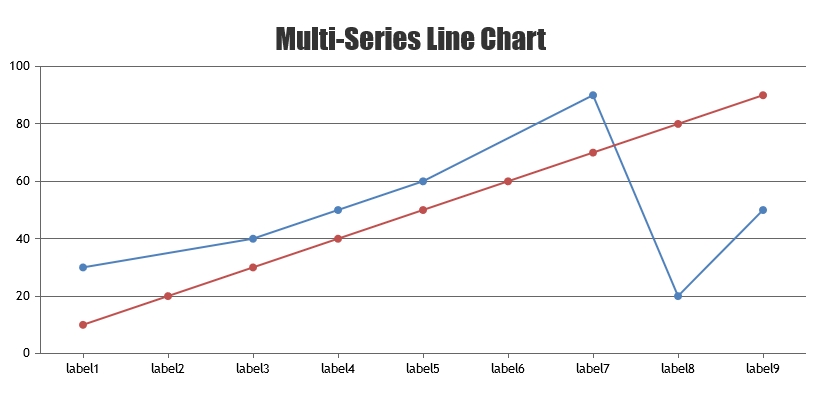
Chart doesn’t automatically group dataPoints by its label. When only label is given (without x-value), internally it assigns x values to dataPoints in an order. So, there can be different dataPoints with same x value but different label. You can pass x-value along with label to group them accordingly. Please find the updated datapoints below.
data: [
    {
      type: "line",
      dataPoints: [
        { x: 1, y: 30, label: "label1" },
        { x: 3, y: 40, label: "label3" },
        { x: 4, y: 50, label: "label4" },
        { x: 5, y: 60, label: "label5" },
        { x: 7, y: 90, label: "label7" },
        { x: 8, y: 20, label: "label8" },
        { x: 9, y: 50, label: "label9"}

      ]
    }, {
      type: "line",
      dataPoints: [
        { x: 1, y: 10, label: "label1" },
        { x: 2, y: 20, label: "label2"},
        { x: 3, y: 30, label: "label3" },
        { x: 4, y: 40, label: "label4" },
        { x: 5, y: 50, label: "label5" },
        { x: 6, y: 60, label: "label6" },
        { x: 7, y: 70, label: "label7" },
        { x: 8, y: 80, label: "label8" },
        { x: 9, y: 90, label: "label9"}

      ]
    }
  ]
Please take a look at this JSFiddle for complete code.