Login to Ask a Question or Reply
Home › Forums › Chart Support › label showing up as null on labelFormatter › Reply To: label showing up as null on labelFormatter
April 16, 2021 at 6:43 pm
#33983
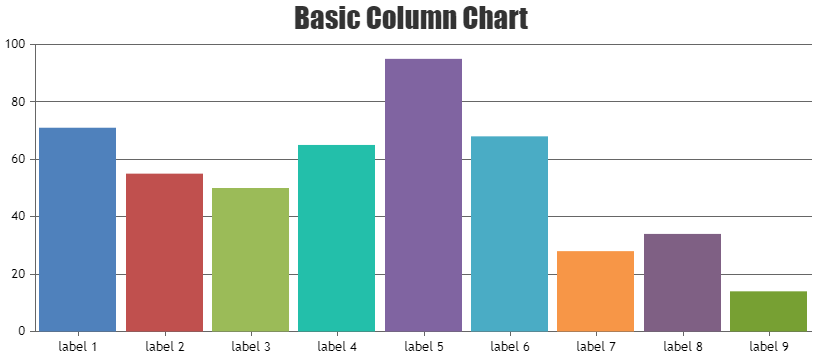
Displaying labels at a specific position(say every midnight) on the axes depends upon the very first label that is rendered, subsequent labels are just rendered at a defined interval(auto-calculated/user-defined) from there. As of now, we do not have control over the starting label on the axes. However in your case, you can show axis labels by passing the year as numeric value instead of datetime as shown in this code snippet.
dataPoints: [
  { x: 2020, y: 71, label: "label 1" },
  { x: 2021, y: 55, label: "label 2" },
  { x: 2022, y: 50, label: "label 3" },
  { x: 2023, y: 65, label: "label 4" },
  { x: 2024, y: 95, label: "label 5" },
  { x: 2025, y: 68, label: "label 6" },
  { x: 2026, y: 28, label: "label 7" },
  { x: 2027, y: 34, label: "label 8" },
  { x: 2028, y: 14, label: "label 9" }
]
Also, take a look at this JSFiddle for an updated example.
—-
Manoj Mohan
Team CanvasJS