@wellhys,
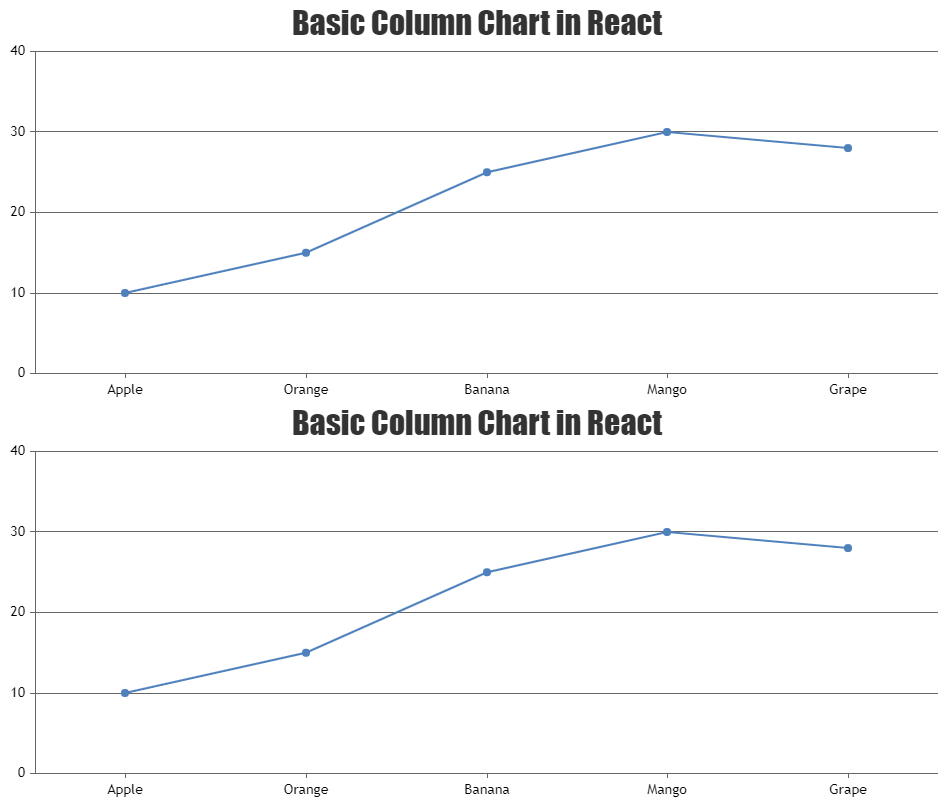
You can render the second chart on clicking datapoints from the first chart using conditional rendering and react state. Please take a look at the code snippet below.
{this.state.clicked && <CanvasJSChart
  options={options}
/>}
Also, check out this StackBlitz for an example with complete code.

—-
Manoj Mohan
Team CanvasJS