Login to Ask a Question or Reply
Home › Forums › Chart Support › React rendering canvasjs chart with mapping › Reply To: React rendering canvasjs chart with mapping
April 7, 2021 at 7:03 pm
#33891
In the code shared by you, there is a syntax error while pushing the chart-options to the options array. Pushing the chart-options as shown in the code snippet below should work fine –
options.push({
title: {
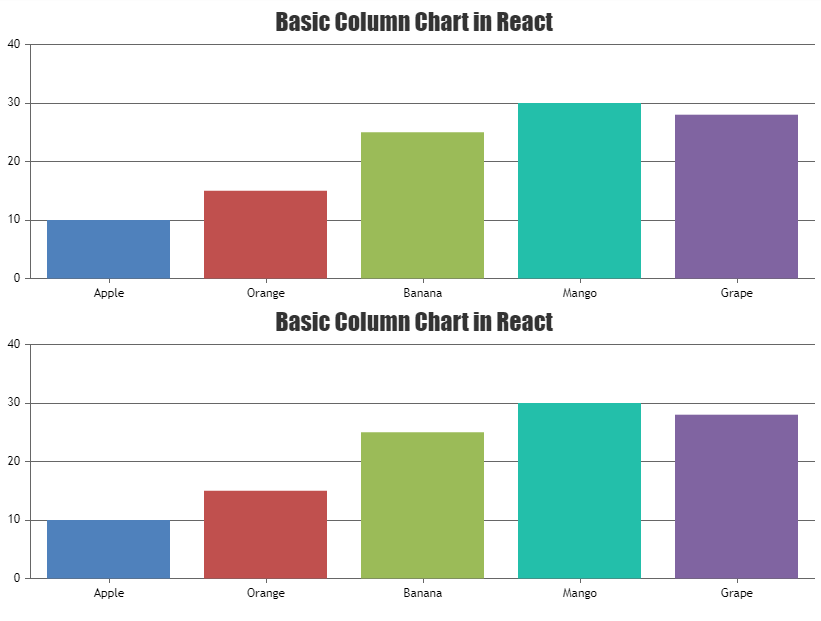
text: "Basic Column Chart in React"
},
data: [{
type: "column",
dataPoints: [
{ label: "Apple", y: 10 },
{ label: "Orange", y: 15 },
{ label: "Banana", y: 25 },
{ label: "Mango", y: 30 },
{ label: "Grape", y: 28 }
]
}]
})Please take a look at this StackBlitz example for a working code.
___________
Indranil Deo
Team CanvasJS