Login to Ask a Question or Reply
Home › Forums › StockChart Support › MarkerType with multiple y-values › Reply To: MarkerType with multiple y-values
Line chart accepts only one y-value but in the JSFiddle shared above you are looking to plot a range of y-value(two y-value) for on the same x-value. In such cases where y-values have a range, you can try using the Range Area Chart or Range Spline Area Chart.
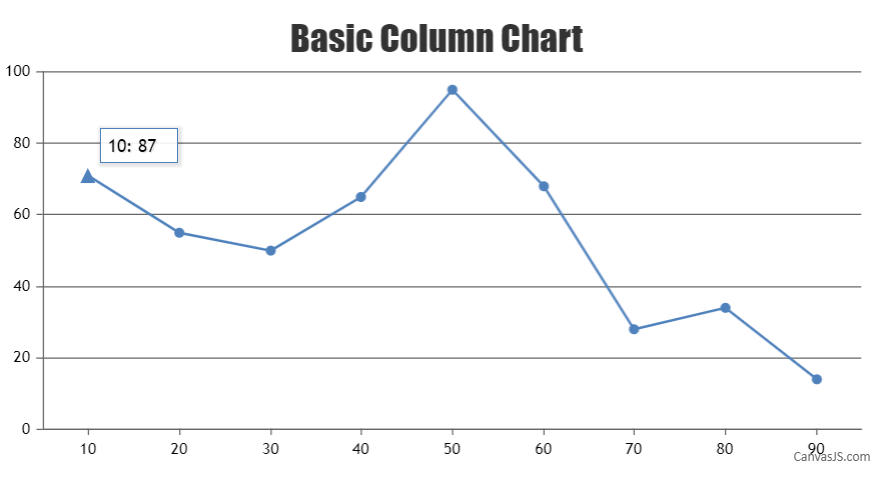
However, as your requirement is to plot a dataPoint at y-value 71 and want to display it as 87 in toolTip you can use toolTipContent property instead of passing two y-values as shown in the code snippet below:
{ x: 10, y: 71, toolTipContent: "{x}: 87", markerType:"triangle" }
Please take a look at this updated JSFiddle for a working example with sample code.
—
Shashi Ranjan
Team CanvasJS