Login to Ask a Question or Reply
Home › Forums › Chart Support › Bubble chart › Reply To: Bubble chart
March 29, 2021 at 7:15 pm
#33751
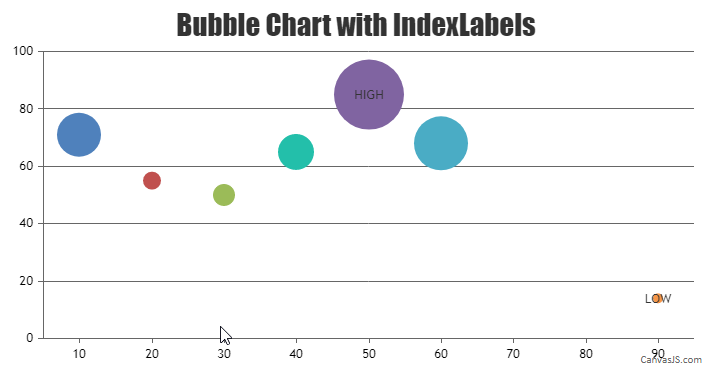
You can use indexLabel property to display text inside the dataPoint in a bubble chart. Although, it is not possible to display the text next to the marker as of now.
Please take a look at this code-snippet for the same,
data: [{
   type: "bubble",
   dataPoints: [
       { x: 10, y: 71, z: 43 },
       { x: 20, y: 55, z: 23 },
       { x: 30, y: 50, z: 25 },
       { x: 40, y: 65, z: 34 },
       { x: 50, y: 85, z: 78, indexLabel: "HIGH" },
       { x: 60, y: 68, z: 54 },
       { x: 90, y: 14, z: 12, indexLabel: "LOW" }
   ]
  }
]
___________
Adithya Menon
Team CanvasJS