Login to Ask a Question or Reply
Home › Forums › Chart Support › markerimage › Reply To: markerimage
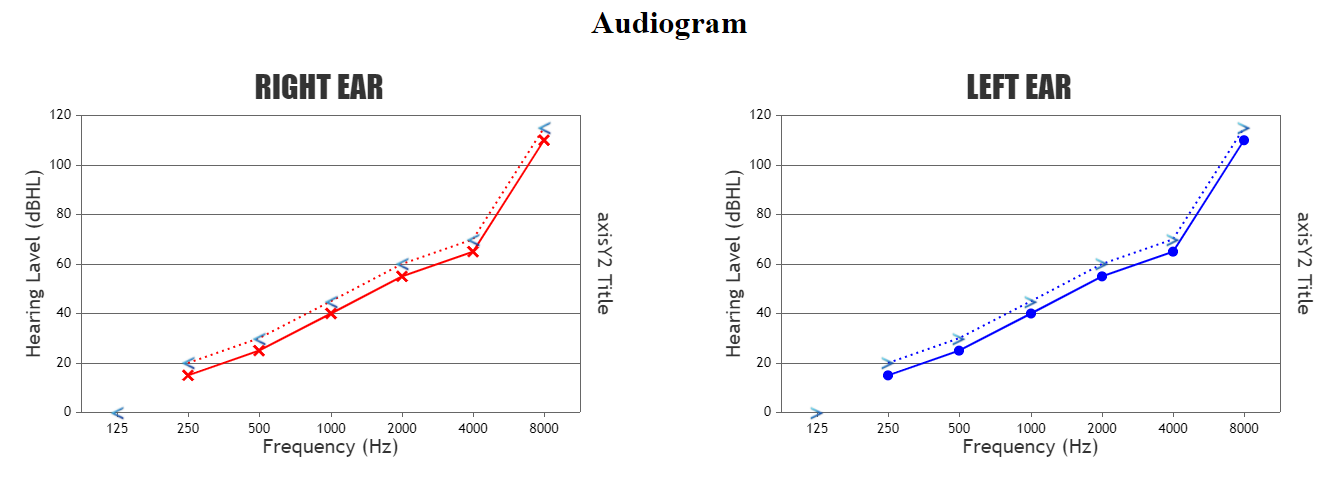
In the link that you have shared, there are couple of issues because of which image is not being shown. Please find them addressed below.
1. Image for the 1st datapoint is not shown as markerImageUrl is not passed to it. Passing markerImageUrl works fine.
{"y":"","label":125, "markerImageUrl":"https:\/\/soundoflife.in\/audiology\/images\/less-than.png"}
2. Images are not being shown in 2nd chart as imageUrl property is being stored in 2nd dataseries of the chart but while passing it as src, you are trying to read it from 1st dataseries. Reading it from 2nd dataseries works fine in this case. Please find the code-snippet below.
function addMarkerImages1(chart1) {
  for (var i = 0; i < chart1.data[1].dataPoints.length; i++) {
    Markers.push($("<img>").attr("src",chart1.data[1].dataPoints[i].ImageUrl)
      .css("display", "none")
      .css("height", 20)
      .css("width", 20)

      .appendTo($("#chartContainer1>.canvasjs-chart-container"))
    );
    positionMarkerImage1(Markers[i], i);
  }
}
If you are still facing issue, kindly create JSFiddle reproducing the issue you are facing and share it with us so that we can look into the code, understand the scenario better and help you out.
—
Vishwas R
Team CanvasJS