Login to Ask a Question or Reply
Home › Forums › Chart Support › Difference for two graph-lines › Reply To: Difference for two graph-lines
March 22, 2021 at 7:34 pm
#33609
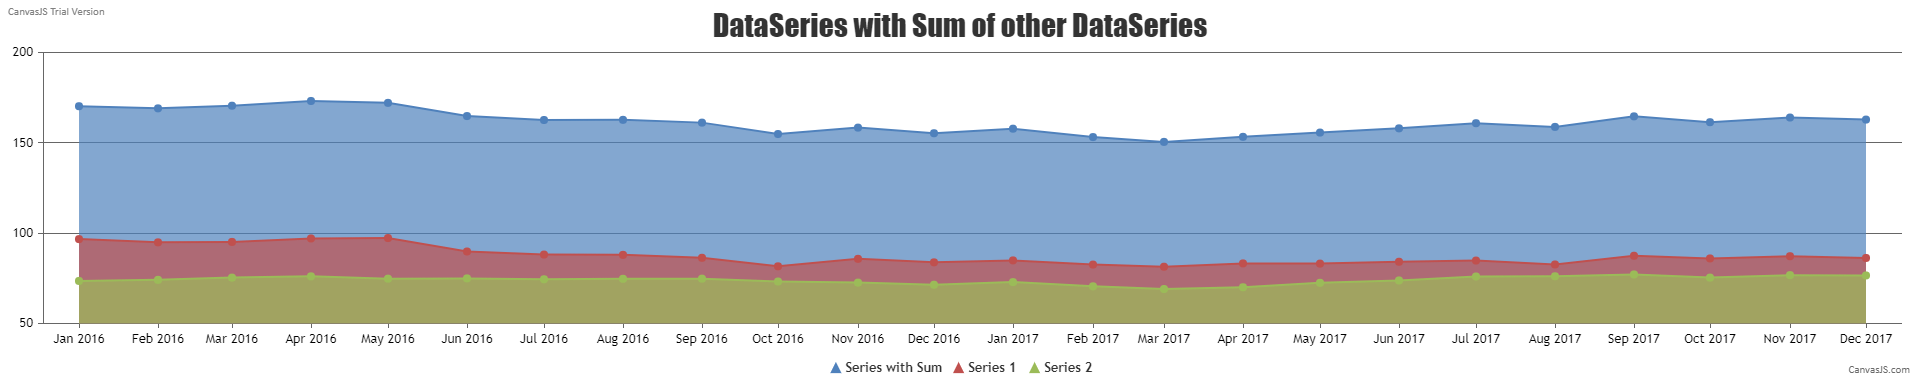
It is possible to create a new dataPoints array by summing up/subtracting each y value of the first 2 dataPoints array as shown below –
function createThirdDataSeries() {
  for(var i = 0; i < dps1.length; i++) {
    dps3.push({x: dps1[i].x, y: dps1[i].y + dps2[i].y})
  }
}
You can create a multi-series area chart by providing each of these dataPoints array as separate dataSeries.
Kindly take a look at this JSFiddle for an example on creating a multi-series area chart with the third dataSeries being the sum of the first two dataSeries.
Also, kindly take a look at this forum thread for your reference.
___________
Adithya Menon
Team CanvasJS