Login to Ask a Question or Reply
Home › Forums › Chart Support › How to set multiple intervalType › Reply To: How to set multiple intervalType
March 20, 2021 at 4:18 am
#33545
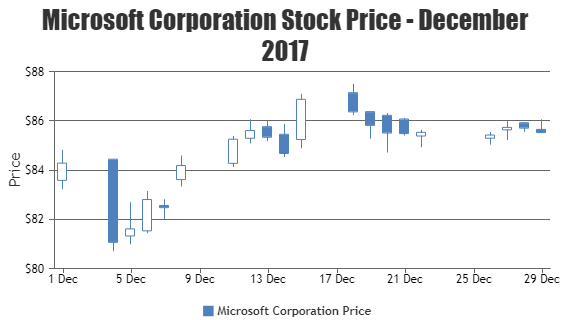
You can set the minimum and maximum of x-axis as a Date object or a timestamp and use valueFormatString to format the axis labels as shown in the code snippet below –
With Date object –
axisX:{
  interval: 30,
  intervalType: "minute",
  minimum: new Date(2012, 01, 03, 09, 00),
  maximum: new Date(2012, 01, 03, 17, 00),
  valueFormatString: "hh:mm tt"
},
With Timestamp –
axisX:{
  interval: 30,
  intervalType: "minute",
  minimum: 1328239800000,
  maximum: 1328268600000,
  valueFormatString: "hh:mm tt"
},
Please take a look at this gallery example to render chart with timestamp in React. Also, kindly check this documentation page for information on rendering chart with date-time axis.

___________
Indranil Deo
Team CanvasJS