Login to Ask a Question or Reply
Home › Forums › Chart Support › Multiple charts in same › Reply To: Multiple charts in same
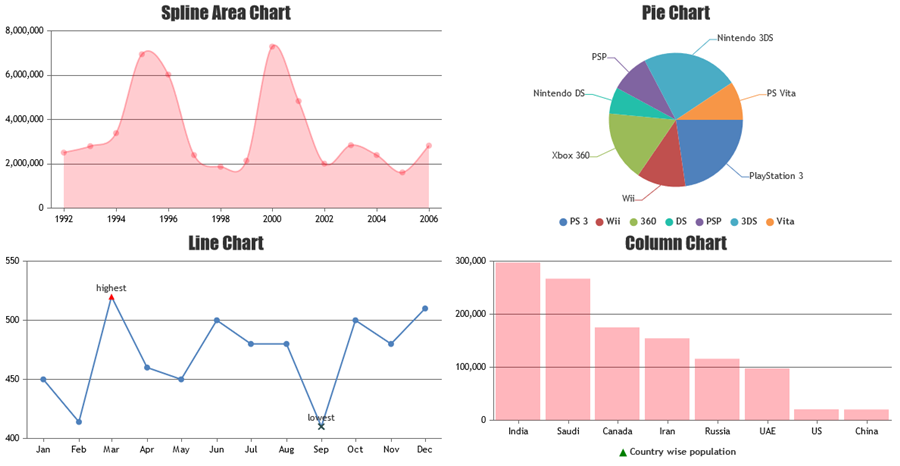
To render multiple charts in a page, you will have to create multiple chartContainers with separate id for each, and create multiple charts which you can assign to specific chartContainers and call the corresponding chart render method.
Please take a look at the code snippet below,
var chart1 = new CanvasJS.Chart("chartContainer1",{
    title :{
        text: "Live Data"
    },
    data: [{
	type: "line",
        dataPoints : [
	    { label: "apple",  y: 10  },
	    { label: "orange", y: 15  },
	    { label: "banana", y: 25  },
	    { label: "mango",  y: 30  },
	    { label: "grape",  y: 28  }
	]
    }]
});
var chart2 = new CanvasJS.Chart("chartContainer2",{
    title :{
	text: "Live Data"
    },
    data: [{
	type: "column",
	dataPoints : [
	    { label: "apple",  y: 10  },
	    { label: "orange", y: 15  },
	    { label: "banana", y: 25  },
	    { label: "mango",  y: 30  },
	    { label: "grape",  y: 28  }
	]
    }]
});

chart1.render();
chart2.render();
Also, kindly take a look at our documentation page for a step-by-step tutorial on how to render multiple charts in a page.

If you are still facing the issue, kindly create JSFiddle reproducing the issue and share it with us so that we can look into the code / chart-options being used, run it at our end to understand the scenario better and help you out.
__
Adithya Menon
Team CanvasJS