Login to Ask a Question or Reply
Home › Forums › Chart Support › chart with data from json › Reply To: chart with data from json
February 17, 2021 at 8:48 pm
#32820
Nicola Presa,
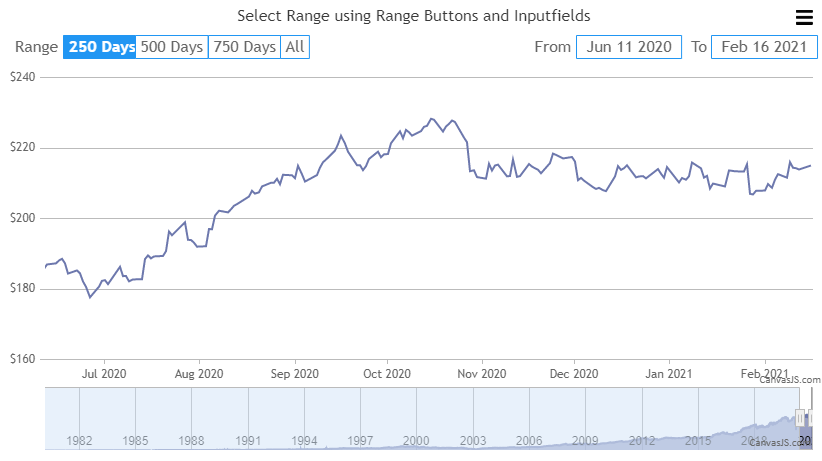
Based on the data you have shared above and considering your requirement, using CanvasJS StockChart will suit your scenario. It comes with built-in features like inputfields and range buttons using which you can select a specific range that is needed to be displayed in the viewport. Selecting the last 250, 500 or 750 days can be achieved using custom range buttons for which you can define the range and rangeType property as shown in the below code snippet.
buttons: [
      {
        label: "250 Days",
        range: 250,
        rangeType: "day"
      },
      {
        label: "500 Days",
        range: 500,
        rangeType: "day"
      },
      {
        label: "750 Days",
        range: 750,
        rangeType: "day"
      },
      {
        label: "All",
        rangeType: "all"
      }
]
Also, for selecting precise date range (data to date range), you can use inputFields. Please take a look at this JSFiddle for an example.
—-
Manoj Mohan
Team CanvasJS