Login to Ask a Question or Reply
Home › Forums › Chart Support › draw one chart with one line for each location › Reply To: draw one chart with one line for each location
February 16, 2021 at 10:28 pm
#32809
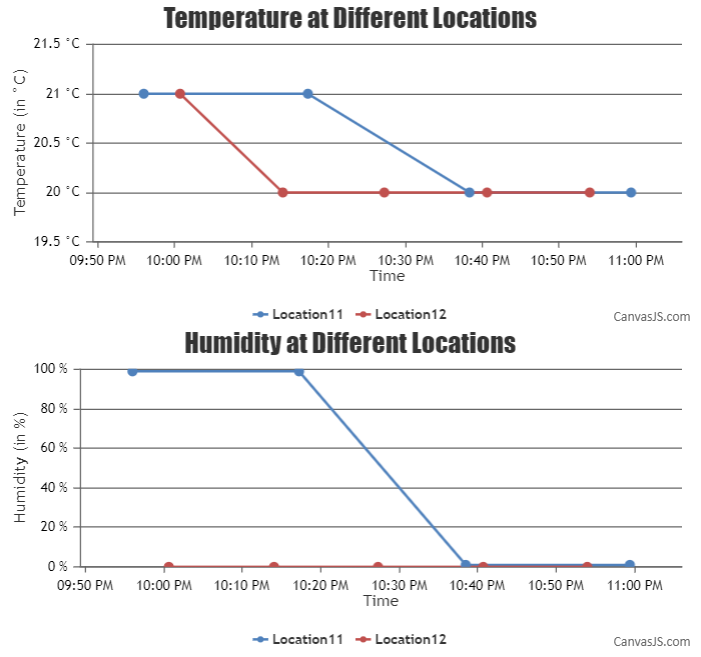
You can display temperature of each location as individual dataseries of the chart, also known as multiseries chart. And humidity in another chart. The sample data(as shared above) can be categorized based on the location parameter and stored as a JSON object. Below is the code snippet for categorizing the data –
for(var i=0; i<data.length; i++){
    if(data[i].e in categorizedData)
      categorizedData[data[i].e].push({x: data[i].x, y: data[i][parameter], e: data[i].e});
    else
      categorizedData[data[i].e] = [{x: data[i].x, y: data[i][parameter], e: data[i].e}];
  }
Then you can use the same JSON object to populate charts based on the categorized data. Please take a look at this JSFiddle for an example.
___________
Indranil Deo
Team CanvasJS