Login to Ask a Question or Reply
Home › Forums › Chart Support › Removing vertical lines and keeping x-axis and y-axis only › Reply To: Removing vertical lines and keeping x-axis and y-axis only
October 25, 2019 at 8:48 pm
#27246
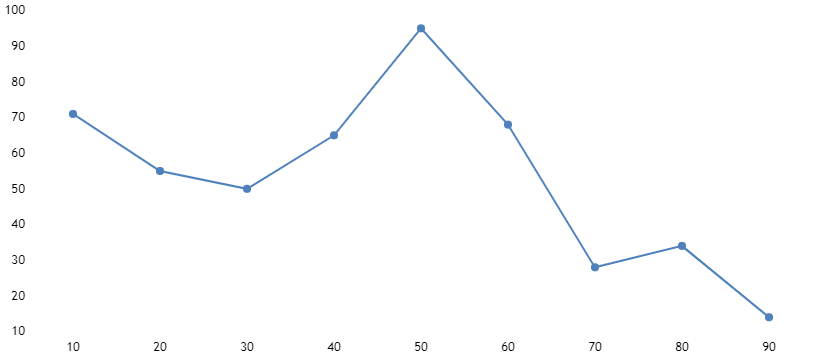
You can remove vertical and horizontal axis lines by setting lineThickness, gridThickness and tickLength to 0 for axisX and axisY as shown in the below code snippet.
axisX:{
	lineThickness: 0,
	tickThickness: 0
},
axisY:{
	lineThickness: 0,
	gridThickness: 0,
	tickLength: 0
}
To make chart background as transparent, you can set backgroundColor property to transparent. Please take a look this JSFiddle for an example on chart with transparent background and without horizontal and vertical axis lines.

—-
Manoj Mohan
Team CanvasJS