Login to Ask a Question or Reply
Home › Forums › Chart Support › how to change color of column in column chart based on values › Reply To: how to change color of column in column chart based on values
October 7, 2019 at 6:04 pm
#27007
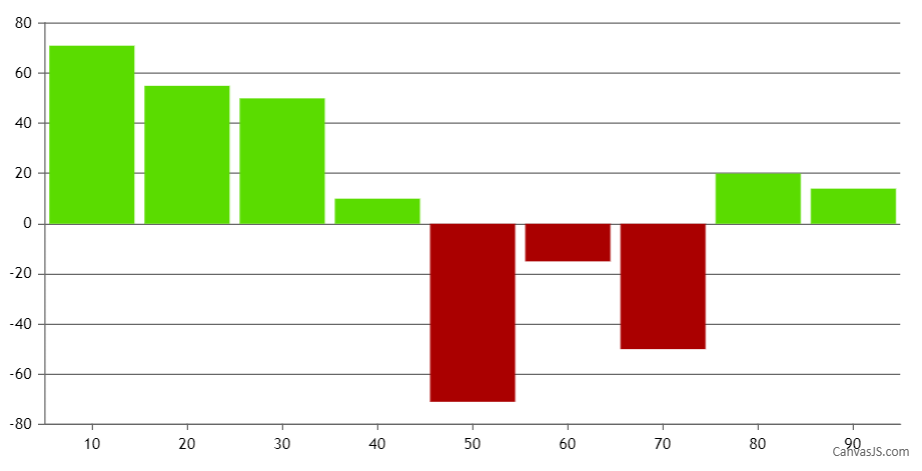
You can change the color of column using color property of dataPoint as shown in the code snippet below –
function setColor(chart){
	for(var i = 0; i < chart.options.data.length; i++) {
  	dataSeries = chart.options.data[i];
  	for(var j = 0; j < dataSeries.dataPoints.length; j++){
    	if(dataSeries.dataPoints[j].y <= 0)
      	dataSeries.dataPoints[j].color = 'rgb(170, 0, 0)';
    }
  }
}
Also, please take a look at this JSFiddle which shows setting different colors to positive and negative values.
—-
Manoj Mohan
Team CanvasJS