Login to Ask a Question or Reply
Home › Forums › Chart Support › loop the graph › Reply To: loop the graph
October 22, 2018 at 11:03 am
#23139
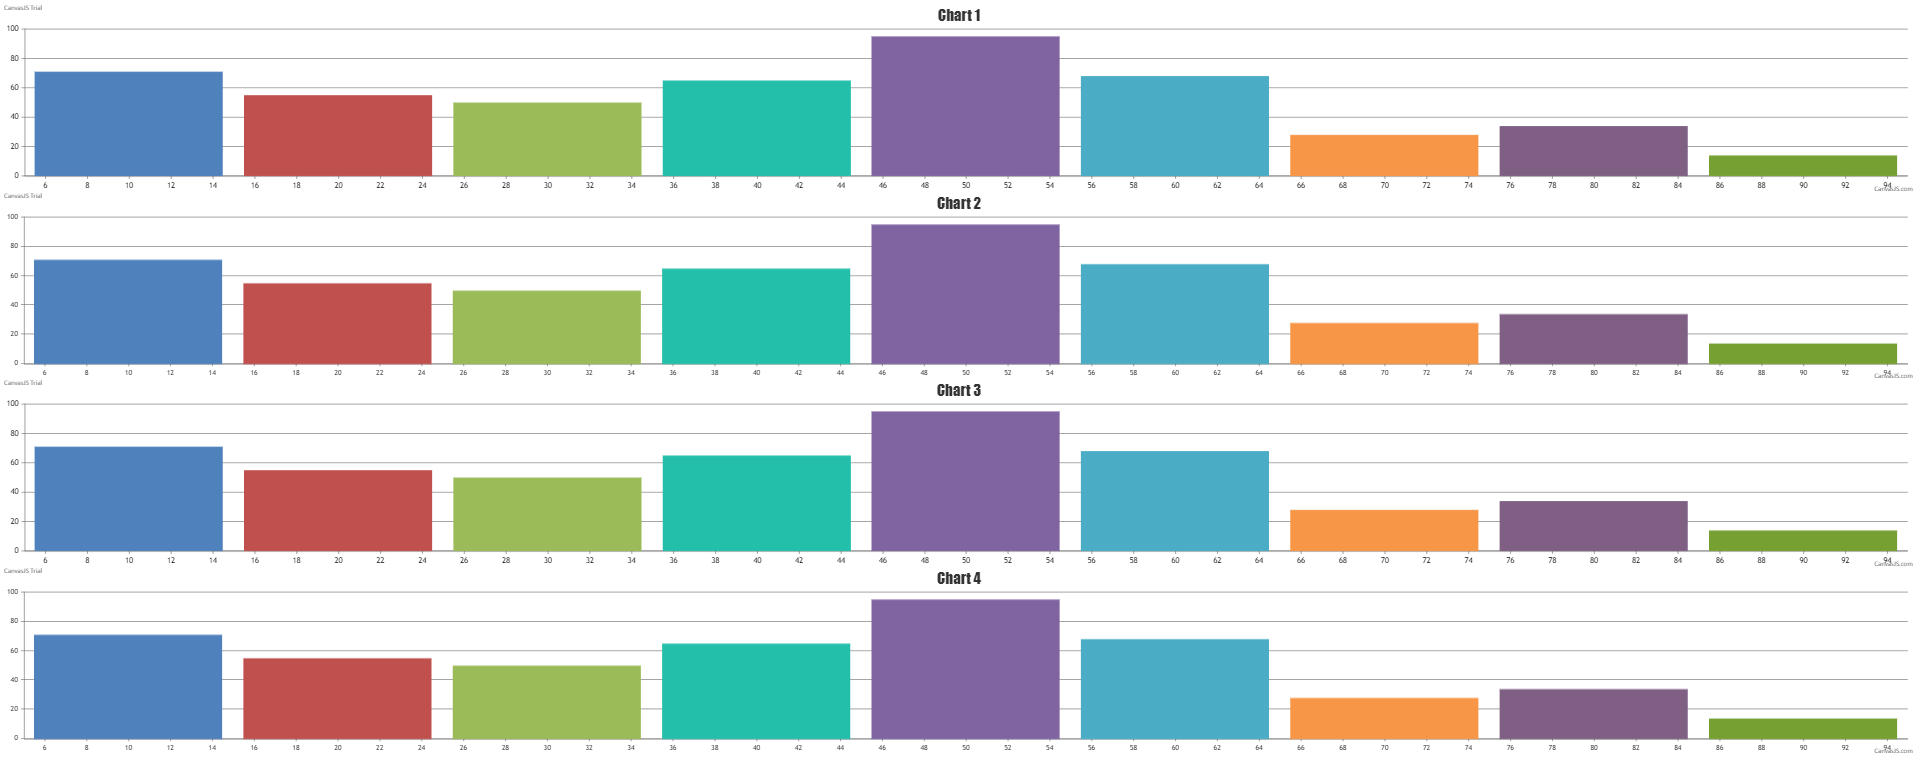
You will need to create chart containers(div) dynamically in order to render multiple charts in a page as shown in the code snippet below:
var noOfCharts = 4;
var charts =[];

var chartOptions = {
    data: [
      {
        type: "column",
        dataPoints: [
          { x: 10, y: 71 },
          { x: 20, y: 55 },
          { x: 30, y: 50 },
          { x: 40, y: 65 },
          { x: 50, y: 95 },
          { x: 60, y: 68 },
          { x: 70, y: 28 },
          { x: 80, y: 34 },
          { x: 90, y: 14 }
        ]
      }
    ]
  };

for(var i = 0; i < noOfCharts; i++) {
  var chartDiv = document.createElement('div');
  chartDiv.setAttribute('id', 'chartContainer' + i);
  chartDiv.style.cssText = 'height: 300px; width: 100%;';
  document.getElementsByTagName('body')[0].appendChild(chartDiv);

  chartOptions.title = { text: "Chart " + (i+1)};
  charts[i] = new CanvasJS.Chart(chartDiv.id, chartOptions);
  charts[i].render();
}
Please take a look at this JSFiddle for a working example with sample code.
__
Priyanka M S
Team CanvasJS