Login to Ask a Question or Reply
Home › Forums › Chart Support › Display data from MySQL database in line chart › Reply To: Display data from MySQL database in line chart
CanvasJS accepts only numeric or dateTime value for x-values and numeric value for y-values.
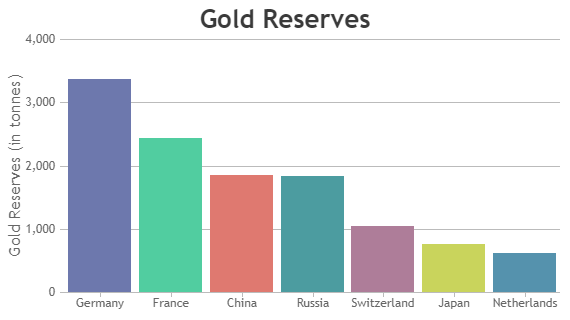
In here, array_push($dataPoints, array("x"=> $row->Name, "y"=> $row->id));, you are assigning string values to x-values and CanvasJS doesn’t accepts string values for dataPoint x-values. You need to assign string values to label to render the chart as shown in the code snippet
array_push($dataPoints, array("label"=> $row->Name, "y"=> $row->id));
Also, you can checkout this Gallery Page for an example in which dataPoints has y-values and labels for rendering the chart in PHP.

If this doesn’t solve your issue, kindly create a sample project reproducing the issue you are facing and share it over Google-Drive or Onedrive along with the sample database so that we can look into your code, understand it better and help you out.
__
Priyanka M S
Team CanvasJS