@sonerb,
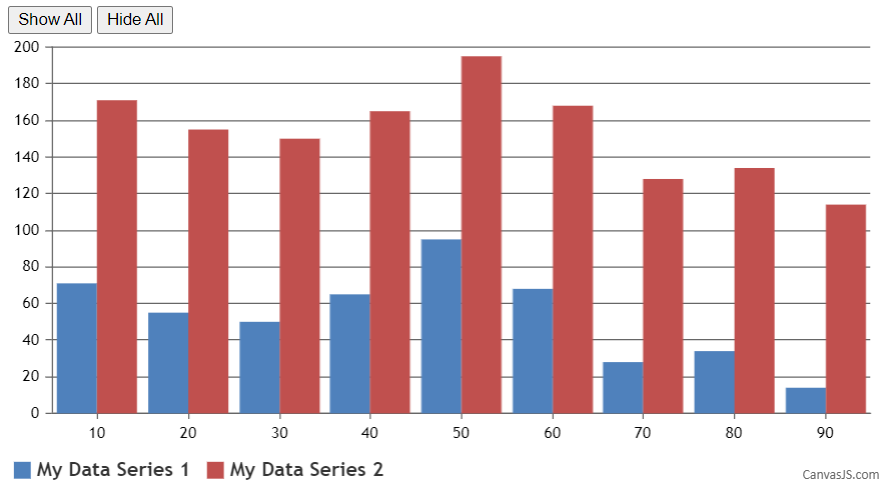
Once the chart is rendered, you can get dataSeries color using get method as shown in the code snippet below –
for(var i = 0; i < chart.data.length; i++) {
   console.log(chart.data[i].get("color"))
}
Please take a look at this jsfiddle.

—
Vishwas R
Team CanvasJS