@govind,
Please take a look at this Gallery Page for an example on rendering dynamic multi-series line chart.
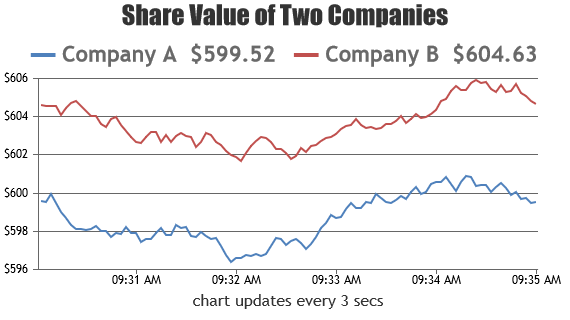
You can remove the extra dataPoints once the length of dataPoints reaches a threshold value with the help of shift method. Please refer to this documentation page for steep-to-step tutorial on Creating Dynamics Charts.
—
Vishwas R
Team CanvasJS