Login to Ask a Question or Reply
Home › Forums › Chart Support › update chart with new values › Reply To: update chart with new values
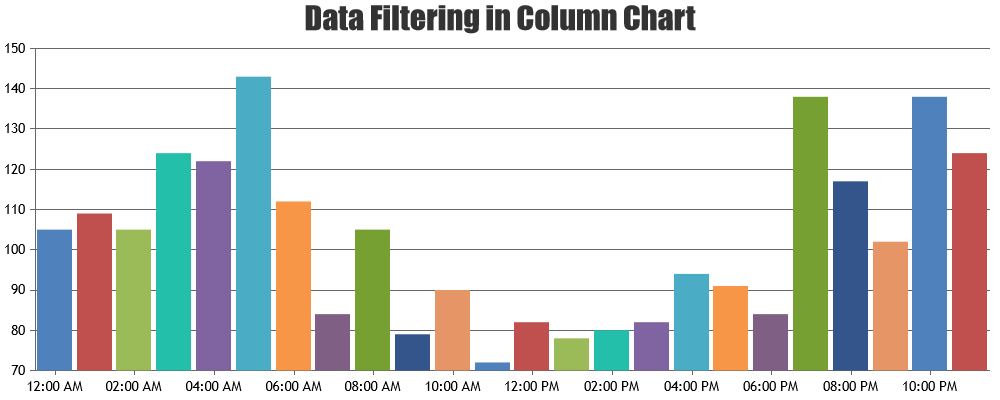
You can perform data filtering based on range of zoomed region with the help of rangeChanging event. Initially you can read all data using AJAX and pass it to chart. Based on range of zoomed-region, you can filter the datapoints upon zooming. Below is the code snippet.
if (e.trigger === "zoom") {
    chart.options.data[0].dataPoints = [];
    if (((e.axisX[0].viewportMaximum - e.axisX[0].viewportMinimum) / hours) < 1) {
        for (var i = 0; i < dps.length; i++) {
            chart.options.data[0].dataPoints.push(dps[i]);
        }
    } else if (((e.axisX[0].viewportMaximum - e.axisX[0].viewportMinimum) / (hours)) < 24) {
        for (var i = 0; i < dps.length; i += 10) {
            chart.options.data[0].dataPoints.push(dps[i]);
        }
    }
}
Please take a look at this JSFiddle for an working example on the same.
moving the code to rangeChanged function it seems the chart is not render properly and i don’t understand why
In the JSFiddle that you have shared, you are generating new dataPoints with x-value as date-time which is outside the range you have zoomed. Because of this you may find chart to be blank after zooming into a certain region – without any dataPoints.
—
Vishwas R
Team CanvasJS