@yansonalvin97,
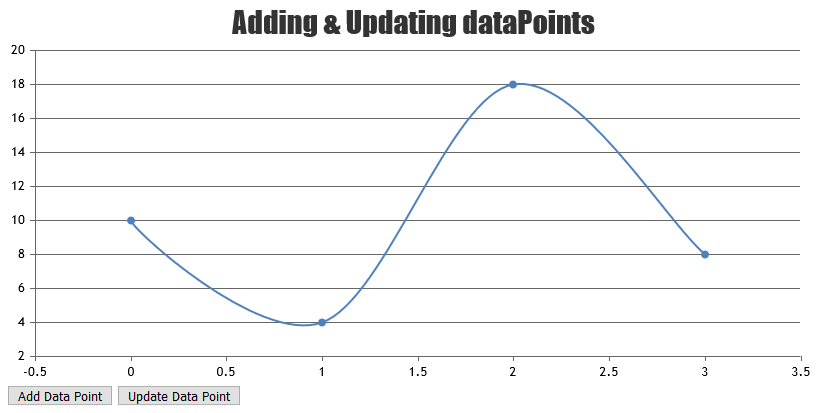
You can update the chart data by changing options and calling chart.render();. Please refer to this documentation page for step-to-step tutorial on the same.

in your case, you need to group the datapoints from JSON based on year. Please take a look at this updated JSFiddle.
Also, we suggest you to initialize chart once before AJAX rather than initializing it on every AJAX calls.
—
Vishwas R
Team CanvasJS