Login to Ask a Question or Reply
Home › Forums › Feature Requests & Feedback › Creating Multi Series Chart in AJAX with JSON › Reply To: Creating Multi Series Chart in AJAX with JSON
May 3, 2018 at 10:27 am
#20545
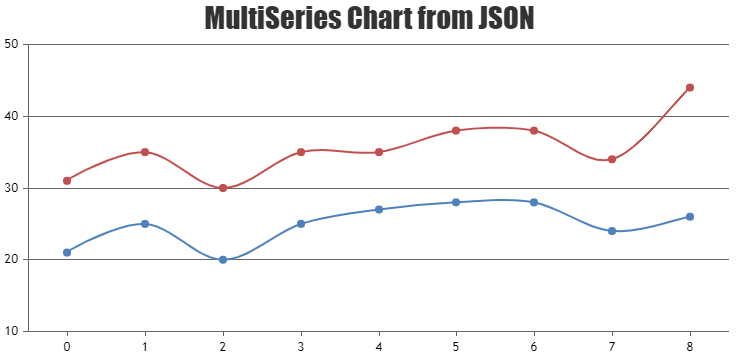
Please refer this documentation page for step-to-step tutorial on rendering chart with data from JSON. Adding another dataseries should let you create multi-series chart. Please find the code-snippet below.
$.getJSON("https://api.npoint.io/bad5c5a9b3669e0ff3ee", function(data) {
for(var i = 0; i < data.length; i++) {
    dps1.push({ label: data[i].label, y: data[i].y1 });
    dps2.push({ label: data[i].label, y: data[i].y2 });
  }
});
Please take a look at this JSFiddle for complete code.

—
Vishwas R
Team CanvasJS