Login to Ask a Question or Reply
Home › Forums › Chart Support › combining candlestick chart and line chart (moving average line) › Reply To: combining candlestick chart and line chart (moving average line)
January 17, 2018 at 12:41 pm
#18877
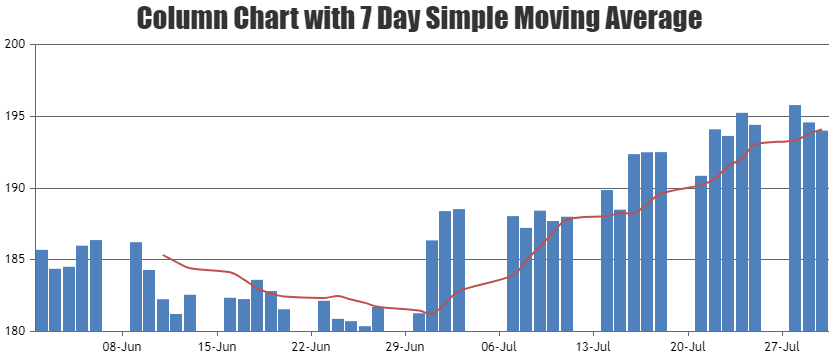
To calculate 7 days Simple Moving Average you can loop through the column series, then sum up consecutive 7 days y-value and use the same in spline series representing Simple Moving Average as shown in the below code snippet –
function calculateMovingAverage(chart) {
  var numOfDays = 7;
  // return if there are insufficient dataPoints
  if(chart.options.data[0].dataPoints.length <= numOfDays) return;
  else {
    // Add a new line series for  Moving Averages
    chart.options.data.push({
      type: "spline",
      markerSize: 0,
      name: "SMA",
      yValueFormatString: "#,##0.00",
      dataPoints: []
    });
    var total;
    for(var i = numOfDays; i < chart.options.data[0].dataPoints.length; i++) {
      total = 0;
      for(var j = (i - numOfDays); j < i; j++) {
        total += chart.options.data[0].dataPoints[j].y;
      }
      chart.options.data[1].dataPoints.push({
        x: chart.options.data[0].dataPoints[i].x,
        y: total / numOfDays
      });
    }
  }
}
Please take a look at this JSFiddle on Column Chart with 7 Day Simple Moving Average. Also kindly have a look at:
1. Creating charts from database in ASP.NET MVC Application.
2. ASP.NET Download Samples
___
Suyash Singh
Team CanvasJS