Login to Ask a Question or Reply
Home › Forums › Chart Support › combining candlestick chart and line chart (moving average line) › Reply To: combining candlestick chart and line chart (moving average line)
November 16, 2017 at 1:15 pm
#17605
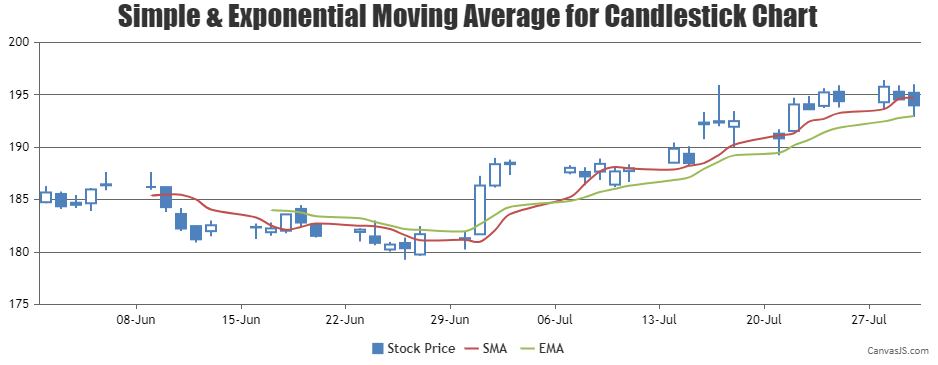
1) what js code would be right for having Exponential Moving Averages instead of SMA.
Yes, you can extend the code further to render Exponential Moving Averages. Please check the below code snippet for calculating Exponential Moving Averages –
function calculateExponentialMovingAverage(chart, emaPeriod) {
  var currentEma = 0, prevEma = 0, temp = 0;

  // Return if there are insufficient dataPoints
  if(chart.options.data[0].dataPoints.length <= emaPeriod) return;

  else {
    chart.options.data.push({
      type: "spline",
      markerSize: 0,
      name: "EMA",
      yValueFormatString: "#,##0.00",
      showInLegend: true,
      dataPoints: []
    });
    for(var i = emaPeriod - 1; i < chart.options.data[0].dataPoints.length; i++) {
      if(i === emaPeriod - 1) {
        // Calculate Simple average upto emaPeriod
        for(var j = 0; j < emaPeriod; j++)
          temp += chart.options.data[0].dataPoints[j].y[3];
        currentEma = temp / emaPeriod;
      } else
        currentEma = chart.options.data[0].dataPoints[i].y[3] * 2 / (emaPeriod + 1) + prevEma * (1 - 2 / (emaPeriod + 1));

      chart.options.data[chart.options.data.length - 1].dataPoints.push({
        x: chart.options.data[0].dataPoints[i].x,
        y: currentEma
      });
      prevEma = currentEma;
    }
  }
}
Also, kindly take a look at this updated JSFiddle.
2) I need 5 EMAs. So I think I can pass those many json datasets in the way you have specified. Right?
Yes, you can add multiple EMA’s to the chart by adding them to data-series array.
___
Suyash Singh
Team CanvasJS