Login to Ask a Question or Reply
Home › Forums › Chart Support › combining candlestick chart and line chart (moving average line) › Reply To: combining candlestick chart and line chart (moving average line)
November 15, 2017 at 12:13 pm
#17580
Thank you for your interest in CanvasJS.
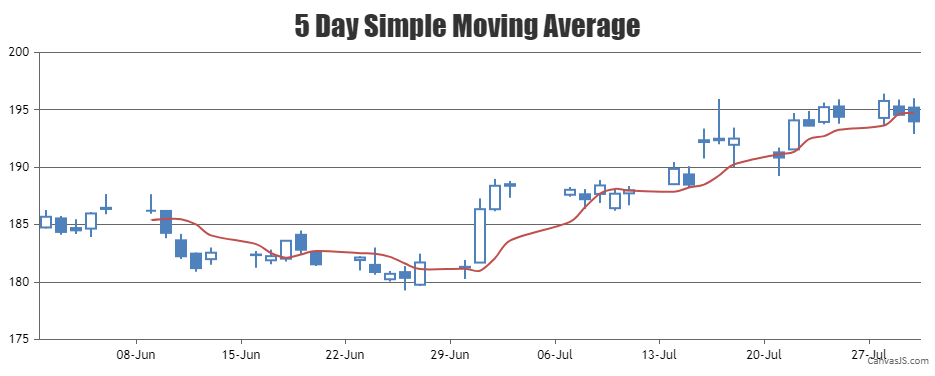
Yes, it can be done. You can combine Candlestick chart with Spline chart, where spline represents the moving averages. You can loop through the candlestick series and use its corresponding dataPoints to dynamically calculate the spline series as shown in the code snippet below –
function calculateMovingAverage(chart) {

  // return if there are insufficient dataPoints
  if(chart.options.data[0].dataPoints.length <= 5) return;
  else {
    // Add a new line series for  Moving Averages
    chart.options.data.push({
      type: "spline",
      markerSize: 0,
      name: "SMA",
      dataPoints: []
    });
    var total;
    for(var i = 5; i < chart.options.data[0].dataPoints.length; i++) {
      total = 0;
      for(var j = (i - 5); j < i; j++) {
        total += chart.options.data[0].dataPoints[j].y[3];
      }
      chart.options.data[1].dataPoints.push({
        x: chart.options.data[0].dataPoints[i].x,
        y: total / 5
      });
    }
  }
}
Please have a look at this JSFiddle for a working example.
___
Suyash Singh
Team CanvasJS