Login to Ask a Question or Reply
Home › Forums › Chart Support › Creating line graph from array of coordinates › Reply To: Creating line graph from array of coordinates
August 18, 2017 at 12:15 pm
#15840
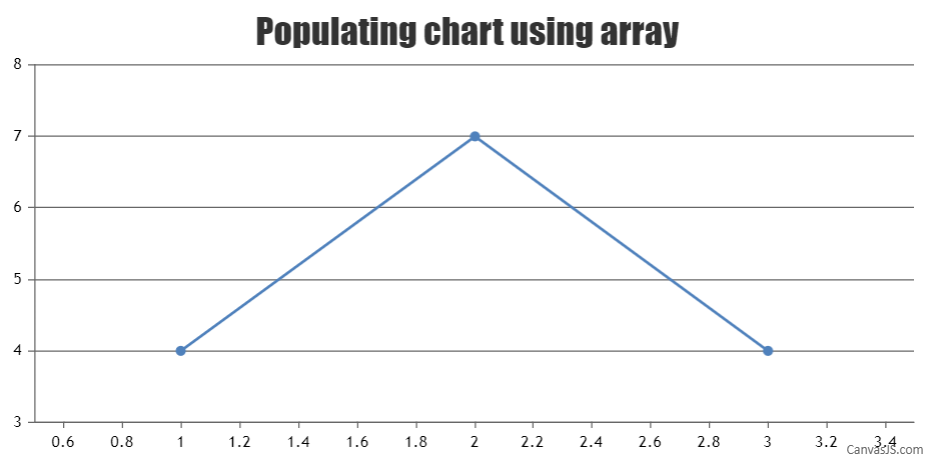
To populate chart from array you can loop through the array and parse it to the format accepted by CanvasJS before passing to the chart options as shown below –
var x1 = [1, 2, 3];
var y1 = [4, 7, 4];
var dataPoints = [];

for (var i = 0; i < 3; i++) {
  dataPoints.push({
    x: x1[i],
    y: y1[i]
  });
}
Please take a look at this JSFiddle for an example.
___________
Indranil Deo
Team CanvasJS