Home › Forums › Feature Requests & Feedback › Timeline Chart (Image Shown) › Reply To: Timeline Chart (Image Shown)
Cristian,
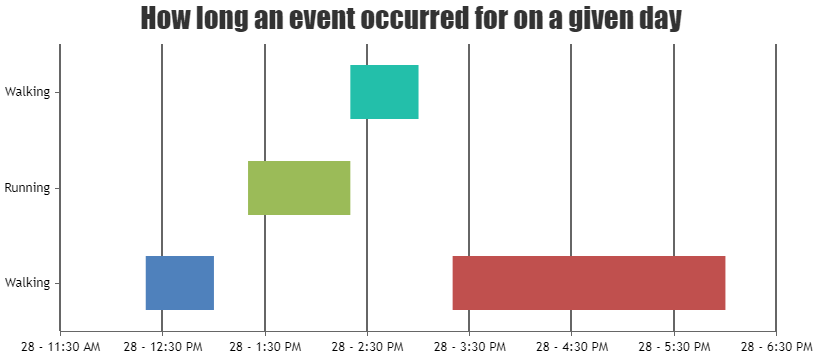
You can display multiple intervals for same label by using x values in the dataPoints. Please have a look at this updated jsfiddle.
___ Suyash Singh Team CanvasJS