Login to Ask a Question or Reply
Home › Forums › Chart Support › How to manage graph size › Reply To: How to manage graph size
April 15, 2017 at 7:44 pm
#14876
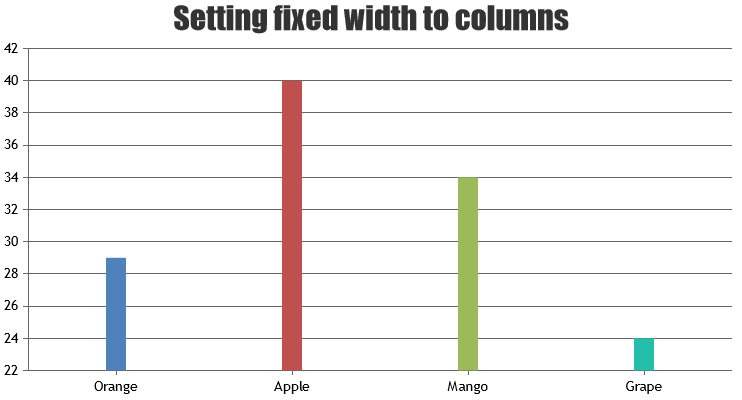
You can set the width of the bars using the dataPointWidth property.
We observed that you are using min-width for setting the height which prevents the the height of the div getting lower than 360px in your case but it is not an absolute value. It would be better if you could follow something like :
<div id="chartContainer" style="height: 360px; width: 100%;"></div>
The label text clips only when the text is very long. If you are still facing some issue, can you please create a jsfiddle reproducing the label clipping?
Also kindly elaborate what do you mean by total graph width.
___
Suyash Singh
Team CanvasJS