@shahid-majeed,
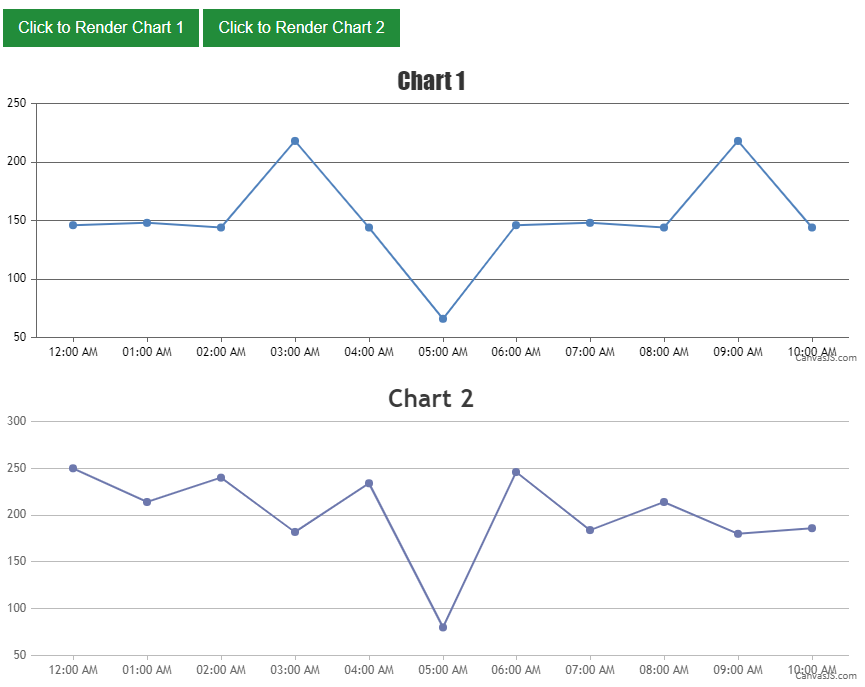
You are passing both x and y values in string value and CanvasJS expects x value to be dateTime or numeric and y value to be numeric. So, converting x value to a valid javascript DateTime format (or you can try with label instead of x) and y value to a number will render the chart properly.
Here is a similar example to render the chart with csv data.

—–
Sanjoy Debnath
Team CanvasJS