Login to Ask a Question or Reply
Home › Forums › Chart Support › Call 2 arrays in the datapoints[ ] › Reply To: Call 2 arrays in the datapoints[ ]
June 23, 2016 at 12:44 pm
#11432
Elina,
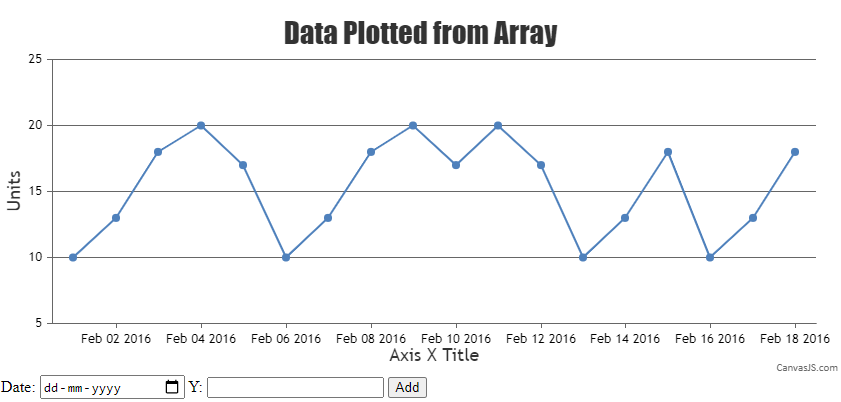
To render the dataPoint with one array for x value and other array for y values, you need to parse the arrays according to data format accepted by CanvasJS. Check out the below code snippet for parsing the arrays.
function parseDataPoints() {
  for (var i = dps.length; i < dateArray.length; i++)
    dps.push({
      x: new Date(dateArray[i]),
      y: numberArray[i]
    });
};
Please take a look at this JSFiddle for complete code sample.

—-
Sanjoy Debnath
Team CanvasJS