• Demos
    • JavaScript Charts
    • JavaScript StockCharts
  • Download/NPM
    • Download CanvasJS
    • Install via NPM
  • Integrations
    Front End Technology Samples
    • React Charts
    • Angular Charts
    • Vue.js Charts New!
    • jQuery Charts
    • Dashboards
    Server Side Technology Samples
    • PHP Charts
    • Python Charts New!
    • ASP.NET MVC Charts
    • Spring MVC Charts
    • JSP Charts
  • License
  • Blog
  • Docs
    • Chart Documentation
    • StockChart Documentation
  • Support Forum
    • Chart Support
    • StockChart Support
  • My Account
My Account
  • KEY FEATURES
  • LINE CHARTS
  • AREA CHARTS
  • COLUMN & BAR CHARTS
  • PIE & FUNNEL CHARTS
  • FINANCIAL CHARTS
  • SCATTER & BUBBLE CHARTS
  • BOX & WHISKER CHARTS
  • COMBINATION CHARTS
  • DYNAMIC CHARTS
  • DATA BINDING
  • REACT, ANGULAR, VUE.JS, JQUERY
  • SERVER SIDE TECHNOLOGIES

ASP.NET MVC Charts & Graphs with Simple API

Download ASP.NET Chart Samples
  • ASP.NET Chart Samples
  • JavaScript Chart Samples
  • React Chart Samples
  • Angular Chart Samples
  • Vue.js Chart Samples
  • jQuery Chart Samples
  • PHP Chart Samples
  • Python Django Chart Samples
  • JSP Chart Samples
  • Spring MVC Chart Samples
  • Dashboard Samples
  • JavaScript StockChart Samples

Add beautiful interactive charts to your ASP.NET MVC applications using CanvasJS. Library supports features like tooltip, zooming, panning, events, drilldown and comes with 30 different types of charts including bar, line, pie, column, area, spline, stacked, range charts, etc. All the graphs are responsive and runs across all devices and browsers(IE8+). Charts are also high performing, which allows you to plot tens of thousands of data points without any lag. It also integrates easily with Bootstrap and several other JavaScript frameworks and libraries.

ASP.NET MVC Charts & Graphs with Zoom & Pan
Chart with Zooming / Panning
ASP.NET MVC Charts & Graphs from JSON Data Using AJAX
Chart using JSON Data
ASP.NET MVC Charts & Graphs with Animation
Chart with Animation
ASP.NET MVC Multi Series Chart
Multi Series Chart
ASP.NET MVC Charts & Graphs with Multiple Axes
Chart with Multiple Axes
ASP.NET MVC Charts & Graphs with Crosshair
Chart with Crosshair
ASP.NET MVC Charts & Graphs with Axis / Scale Breaks
Chart with Scale Breaks
ASP.NET MVC Charts & Graphs with Logarithmic Axis
Chart with Logarithmic Axis
ASP.NET MVC Charts & Graphs with Large number of Data Points
Performance with 50,000 Data Points
Responsive ASP.NET MVC Charts & Graphs
Responsive Charts
ASP.NET MVC Drilldown Charts & Graphs
Chart with Drilldown

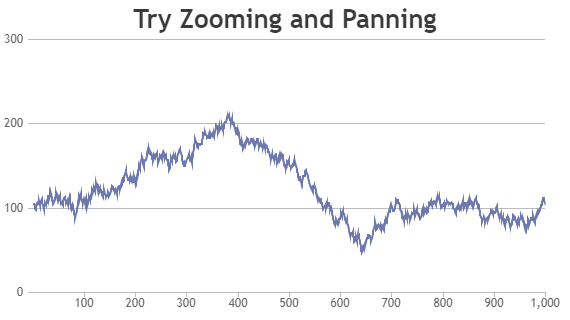
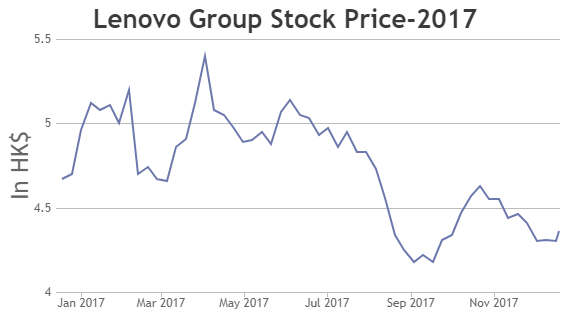
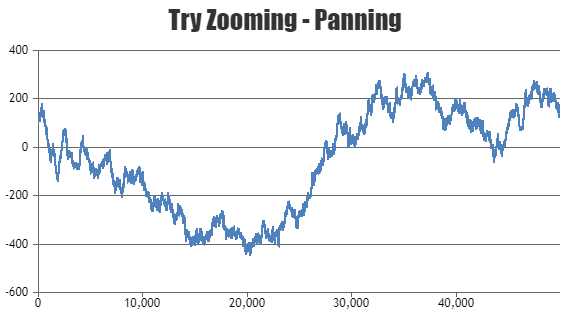
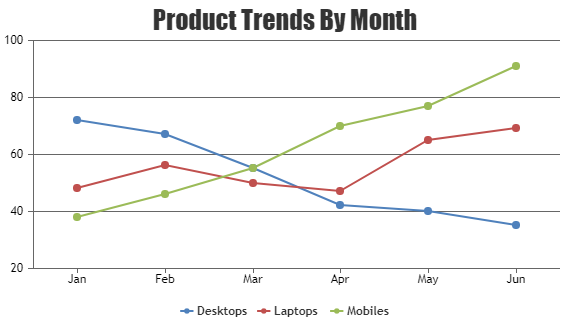
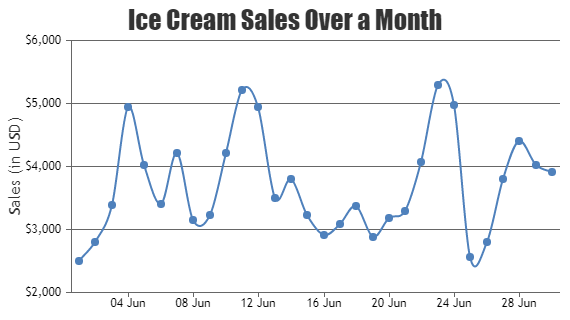
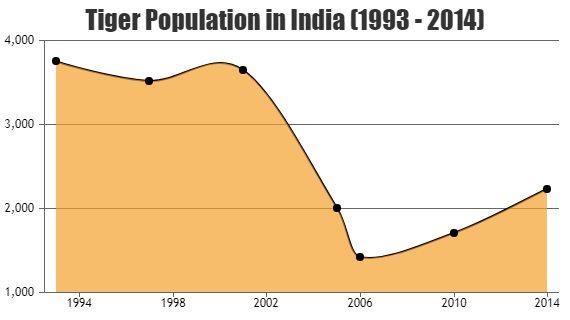
Line Charts in ASP.NET MVC

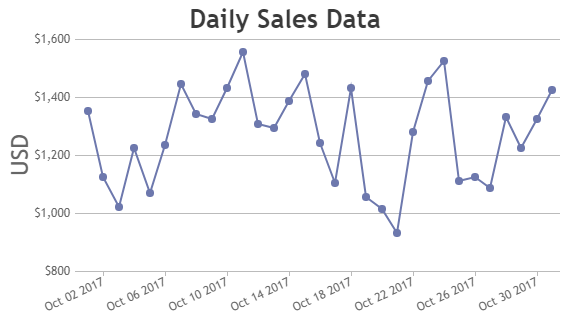
Contains Line, Spline and Step Line Charts.

ASP.NET MVC Line Charts & Graphs
ASP.NET MVC Line Chart
ASP.NET MVC Spline Charts & Graphs
Spline Chart
ASP.NET MVC Step Line Charts & Graphs
Step Line Chart

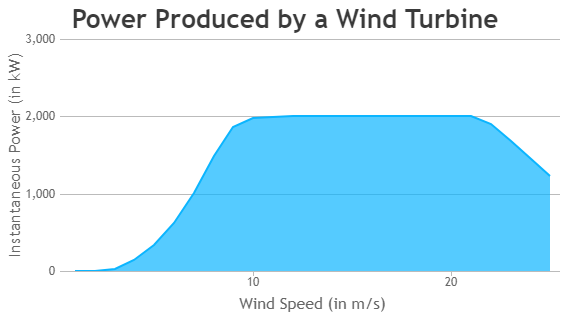
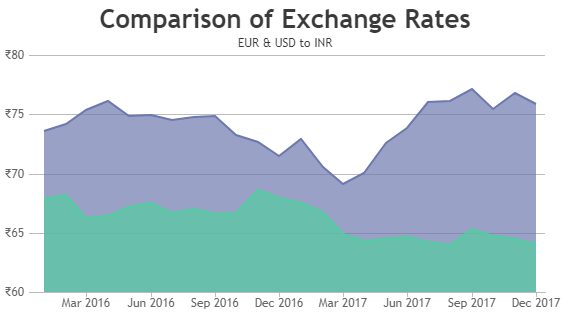
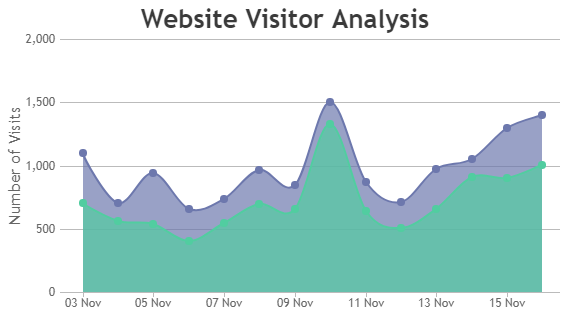
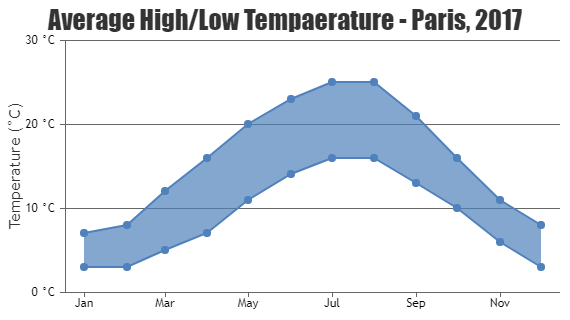
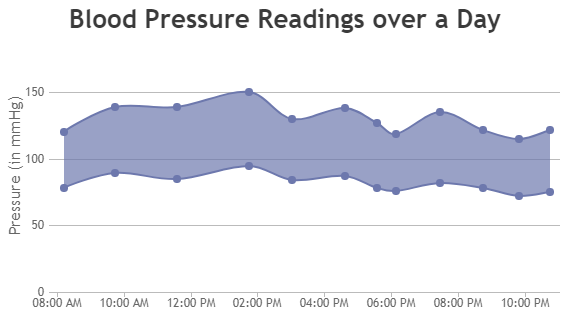
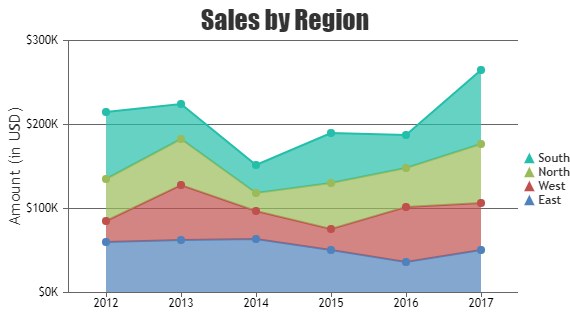
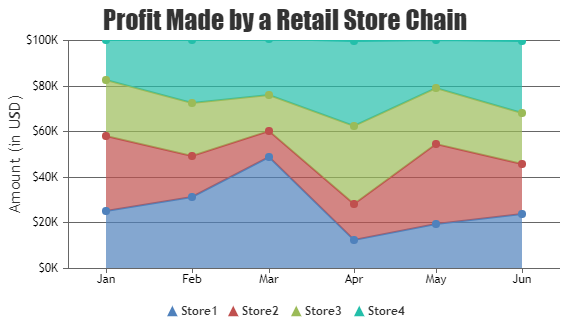
Area Charts in ASP.NET MVC

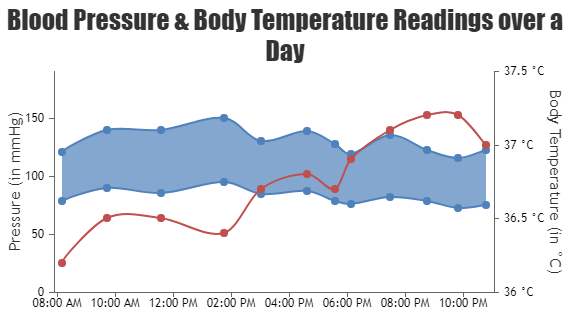
Contains Area, Spline Area, Stacked Area, Stacked Area 100, Step Area, Range Area and Range Spline Area Charts.

ASP.NET MVC Area Charts & Graphs
ASP.NET MVC Area Chart
ASP.NET MVC Multi Series Area Charts & Graphs
Multi Series Area Chart with Date Time Axis
ASP.NET MVC Spline Area Charts & Graphs
Spline Area Chart
ASP.NET MVC Multi Series Spline Area Charts
Multi Series Spline Area
ASP.NET MVC Step Area Charts & Graphs
Step Area Chart
ASP.NET MVC Range Area Charts & Graphs
Range Area Chart
ASP.NET MVC Range Spline Area Charts & Graphs
Range Spline Area Chart
ASP.NET MVC Stacked Area Charts & Graphs
Stacked Area Chart
ASP.NET MVC Stacked Area 100% Charts & Graphs
Stacked Area 100% Chart

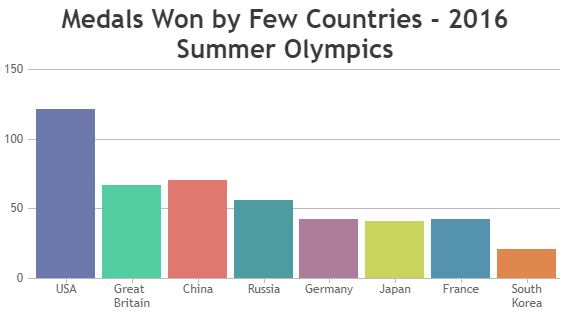
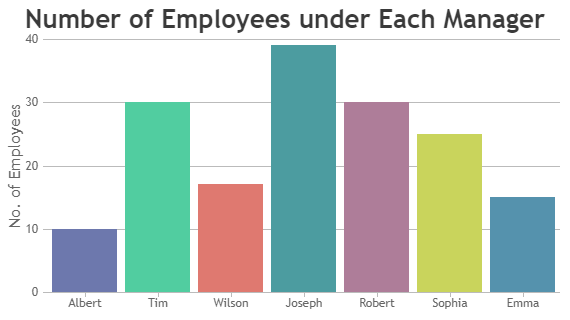
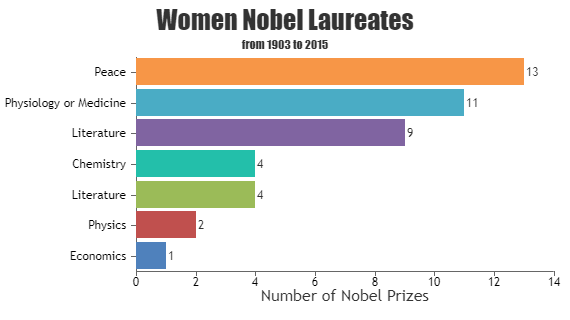
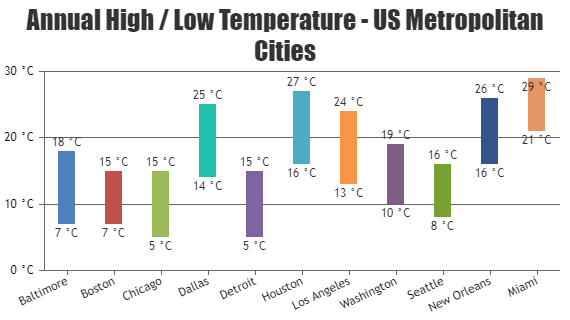
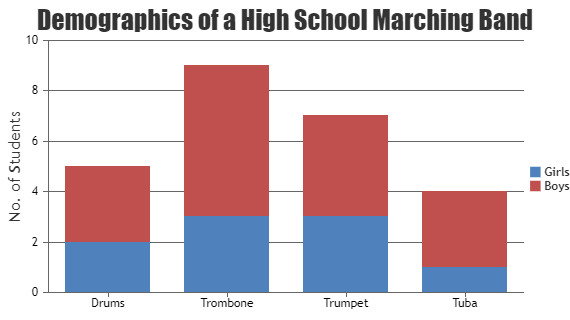
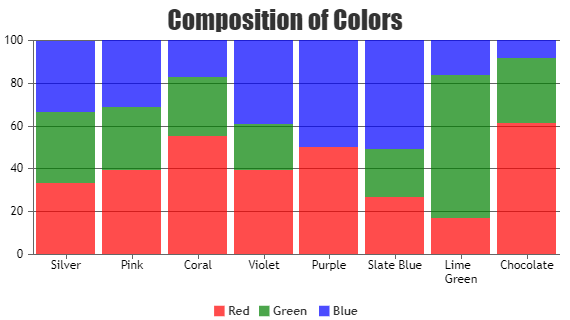
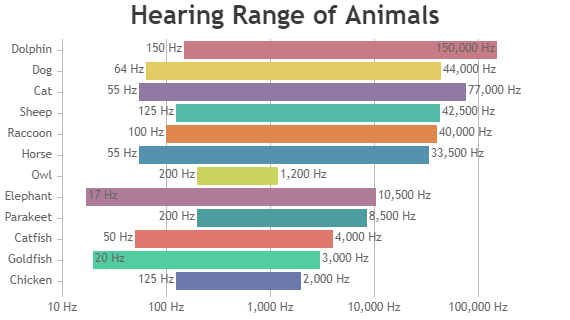
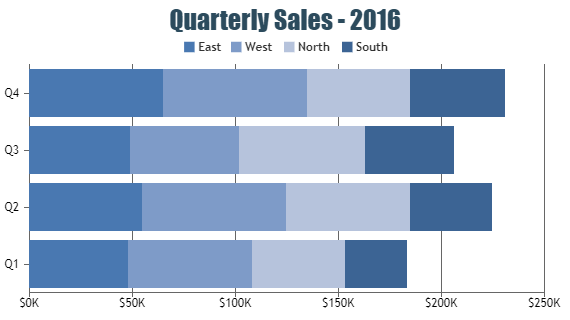
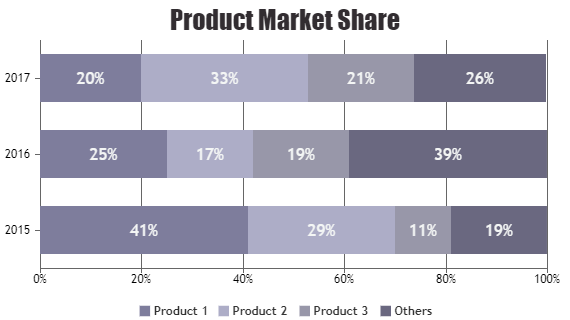
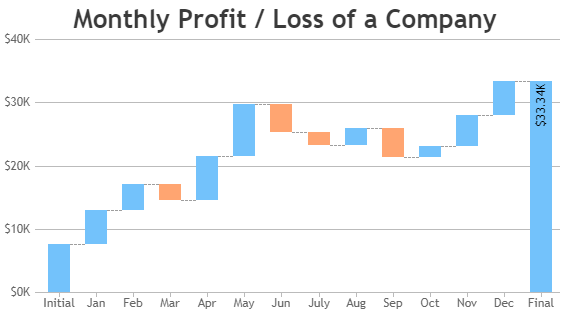
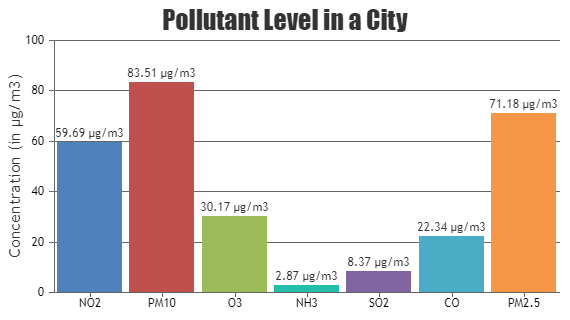
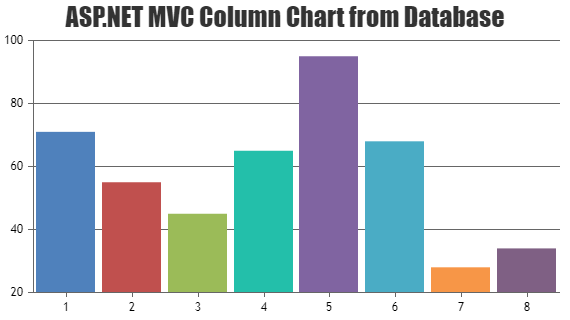
Column and Bar Charts in ASP.NET MVC

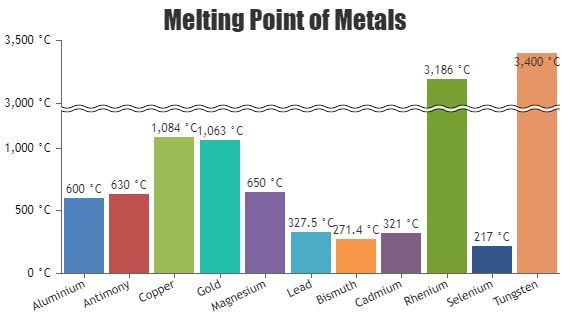
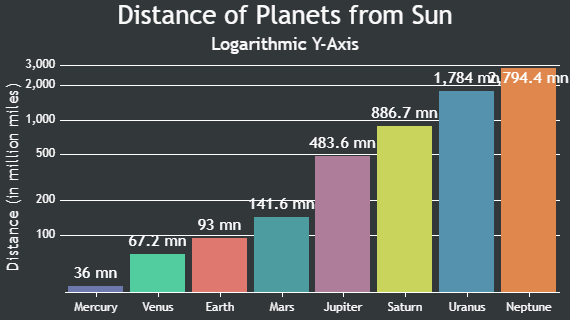
Contains Column, Bar, Stacked Column, Stacked Column 100%, Range Column, Stacked Bar, Stacked Bar 100%, Range Bar and Waterfall Charts.

ASP.NET MVC Column Charts & Graphs
ASP.NET MVC Column Chart
ASP.NET MVC Bar Charts & Graphs
Bar Chart
ASP.NET MVC Range Column Charts & Graphs
Range Column Chart
ASP.NET MVC Stacked Column Charts & Graphs
Stacked Column Chart
ASP.NET MVC Stacked Column 100% Charts & Graphs
Stacked Column 100% Chart
ASP.NET MVC Range Bar Charts & Graphs
Range Bar Chart
ASP.NET MVC Stacked Bar Charts & Graphs
Stacked Bar Chart
ASP.NET MVC Stacked Bar 100% Charts & Graphs
Stacked Bar 100% Chart
ASP.NET MVC Waterfall Charts with Custom Colors
Waterfall Chart

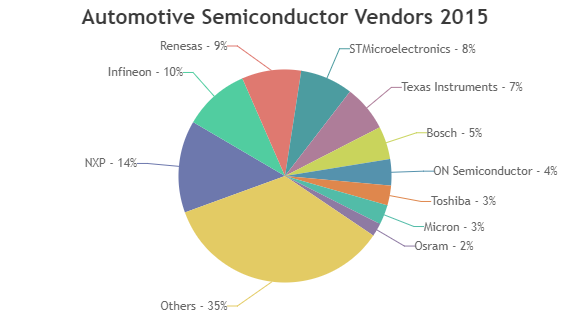
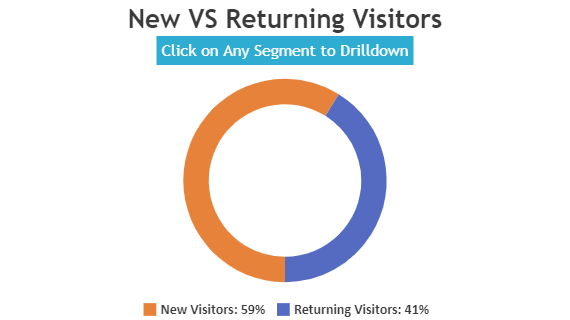
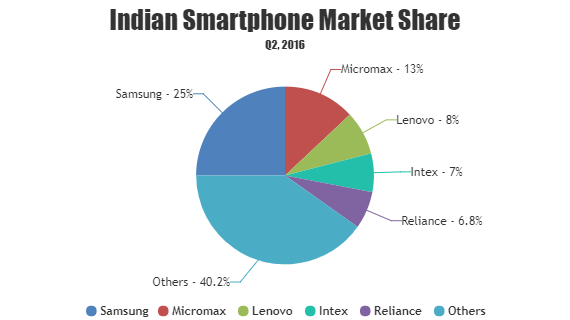
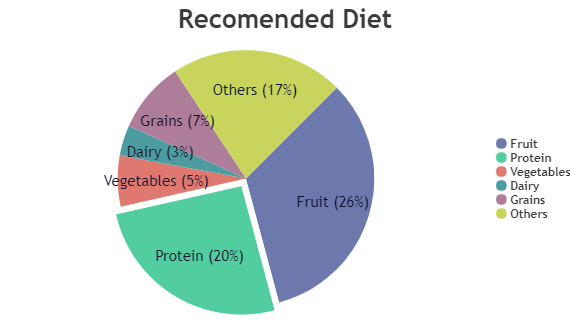
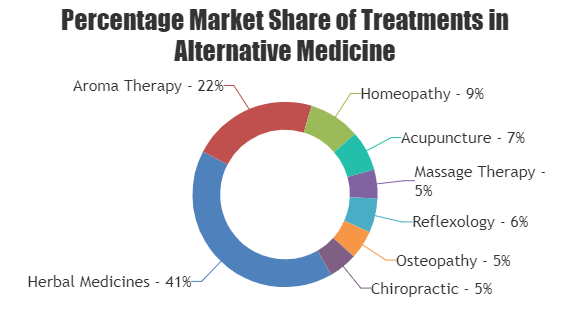
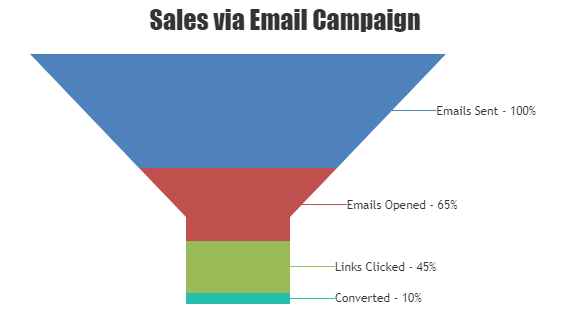
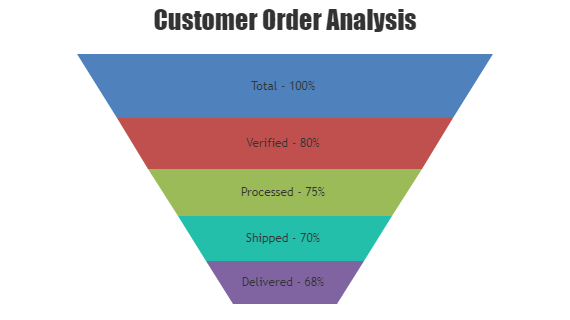
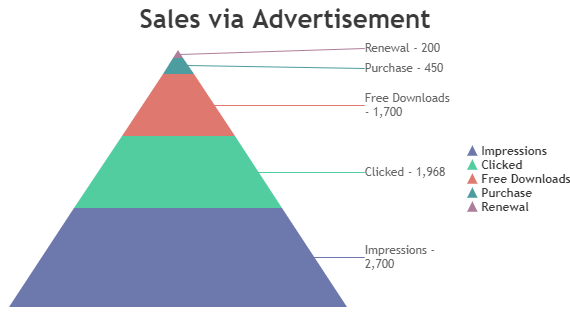
Pie and Funnel Charts in ASP.NET MVC

Contains Pie, Doughnut / Donut, Funnel and Pyramid Charts.

ASP.NET MVC Pie Charts & Graphs
ASP.NET MVC Pie Chart
ASP.NET MVC Pie Charts with Index / Data Labels placed Inside
Pie Chart with Index Labels Placed Inside
ASP.NET MVC Doughnut / Donut Charts & Graphs
Doughnut Chart
ASP.NET MVC Funnel Charts & Graphs
Funnel Chart
ASP.NET MVC Funnel Charts with Custom Neck Height and Width
Funnel Chart with Custom Neck
ASP.NET MVC Pyramid Charts & Graphs
Pyramid Chart

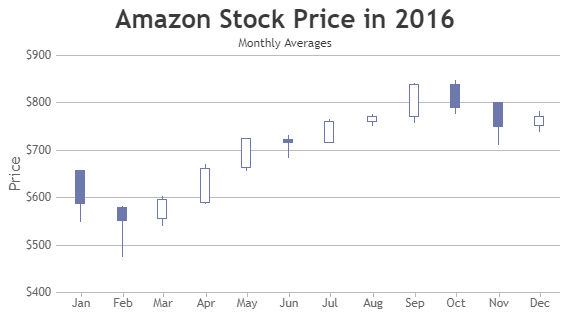
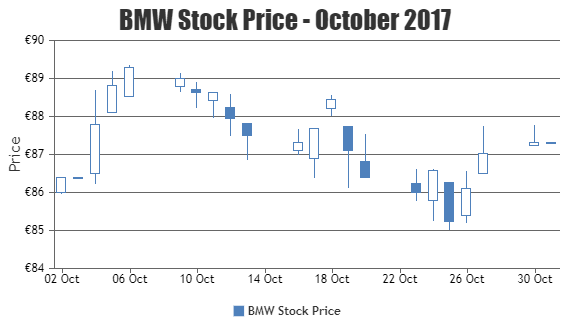
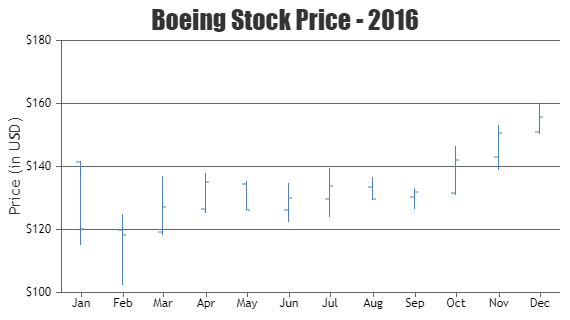
Financial Charts in ASP.NET MVC

Contains Candlestick and OHLC Charts.

ASP.NET MVC Candlestick Charts & Graphs
ASP.NET MVC Candlestick Chart
ASP.NET MVC Candlestick Charts from JSON Data using AJAX
Candlestick Chart from JSON
ASP.NET MVC OHLC Charts & Graphs
OHLC Chart

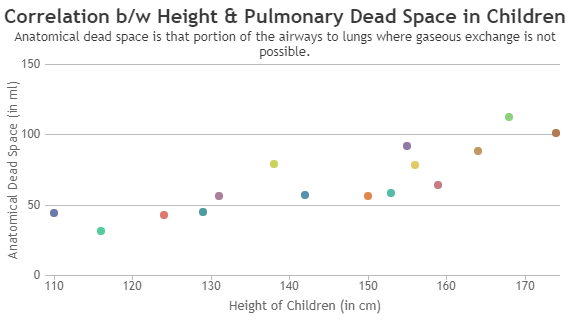
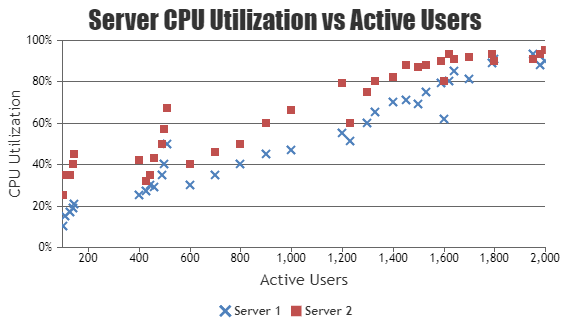
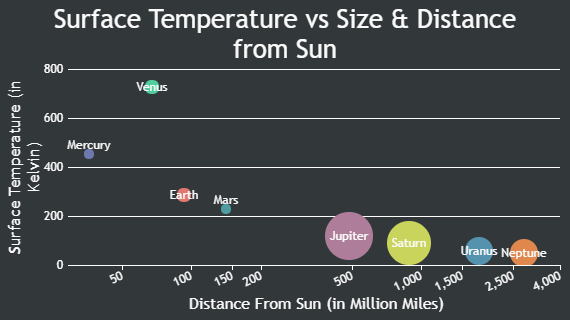
Scatter & Bubble Charts in ASP.NET MVC

Contains Scatter and Bubble Charts.

ASP.NET MVC Scatter / Point Charts & Graphs
ASP.NET MVC Scatter Chart
ASP.NET MVC Scatter Charts with Custom Markers
Scatter Chart with Custom Markers
ASP.NET MVC Bubble Charts & Graphs
Bubble Chart

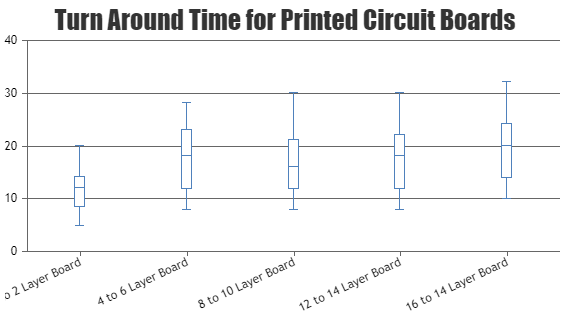
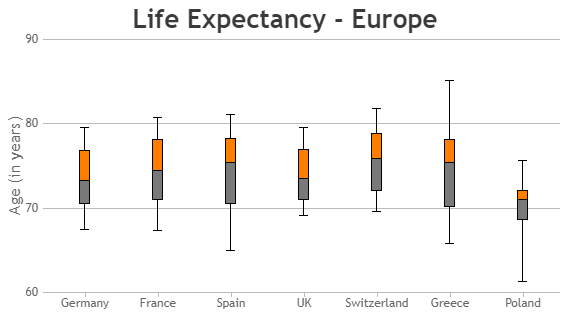
Box & Whisker Charts in ASP.NET MVC

Contains Box and Whisker Charts also Known as Box Plot Charts.

ASP.NET MVC Box And Whisker Charts & Graphs
Box & Whisker Chart
ASP.NET MVC Box And Whisker Chart with Customization
Box and Whisker Chart with Customization

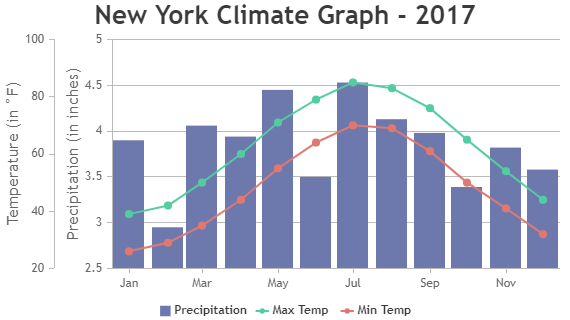
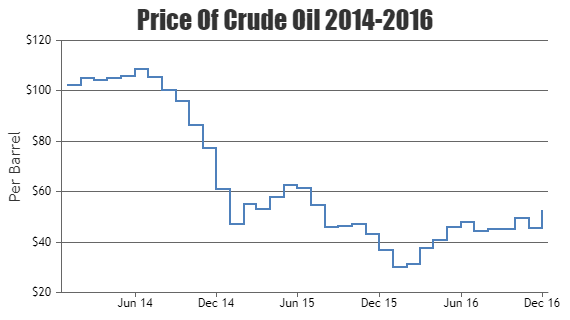
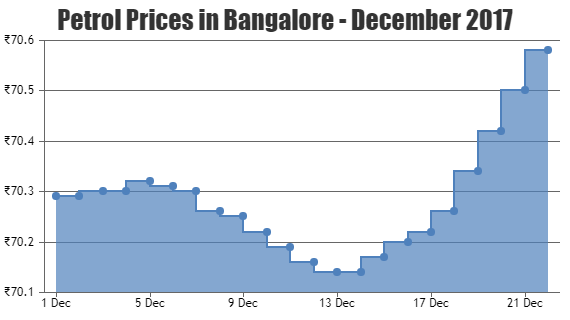
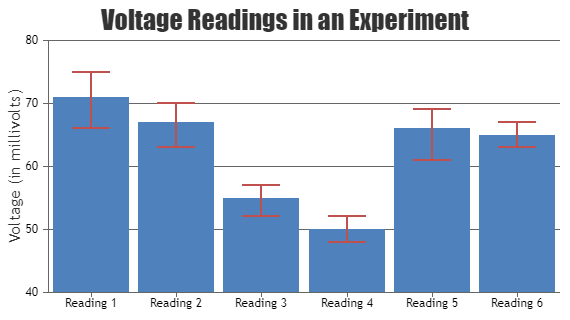
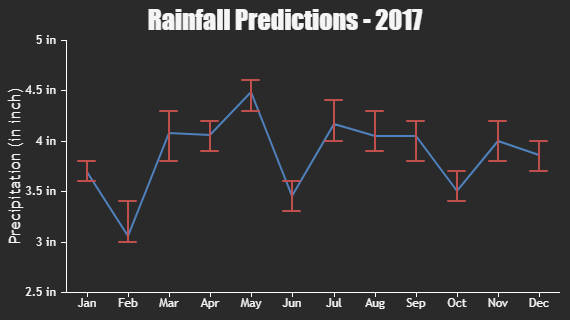
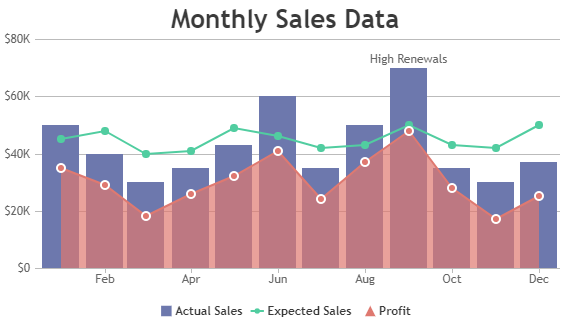
Combination Charts in ASP.NET MVC

Contains Error, Error Line Charts along with combination of many other Charts like Bar, Line, Area, OHLC, etc.

ASP.NET MVC Error Charts & Graphs
ASP.NET MVC Error chart
ASP.NET MVC Error Line Charts & Graphs
Error Line Chart
Combination of ASP.NET MVC Line, Area and Column Charts
Combination of Column, Line and Area Chart

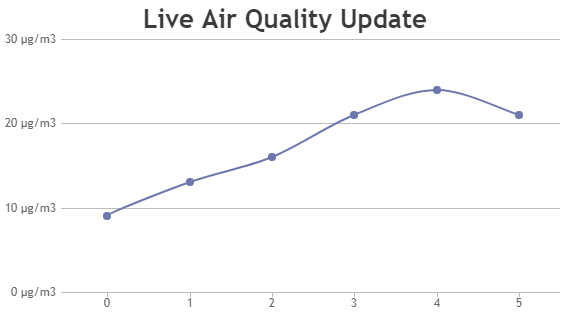
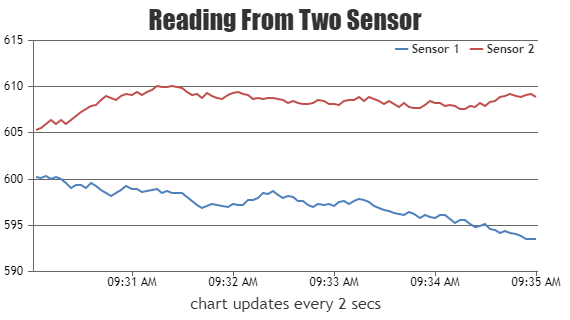
Dynamic Charts in ASP.NET MVC

Contains Dynamic Charts also known as Real Time or Live Charts.

ASP.NET MVC Dynamic / Live Line Charts & Graphs
Dynamic Line Chart
ASP.NET MVC Dynamic / Live Column Charts & Graphs
Dynamic Column Chart
ASP.NET MVC Dynamic / Live Multi Series Chart
Dynamic Multi Series Chart

Data Binding in ASP.NET MVC

Contains Chart samples with Data coming from sources like CSV, XML, Database.

ASP.NET MVC Chart from CSV Data
Chart from CSV
ASP.NET MVC Chart from XML Data
Chart from XML
ASP.NET MVC Chart Data from Database
Chart Data from Database

React, Angular, Vue.js, jQuery

Add Responsive & Interactive Chart to your front-end frameworks like React, Angular, Vue.js, etc.

React Charts & Graphs
React Charts
Angular Charts & Graphs
Angular Charts
Vue.js Charts & Graphs
Vue.js Charts
jQuery Charts & Graphs
jQuery Charts
JavaScript Charts & Graphs
JavaScript Charts

Server Side Technologies

Integrates easily with PHP, Python, JSP and many other Libraries and Frameworks.

Beautiful Charts for your PHP Applications
PHP Charts
Python Charts & Graphs
Python Charts
JSP Charts & Graphs
JSP Charts
Spring MVC Charts & Graphs
Spring MVC Charts

Quick Links

  • Chart Docs
  • StockChart Docs
  • About Us
  • FAQs

Server Side Technologies

  • ASP.NET MVC Charts
  • PHP Charts
  • JSP Charts
  • Spring MVC Charts

Front Side Technologies

  • JavaScript Charts
  • jQuery Charts
  • React Charts
  • Angular Charts
  • JavaScript StockCharts

Contact

  • Fenopix, Inc.
  • 2093 Philadelphia Pike,
  • #5678, Claymont,
  • Delaware 19703
  • United States Of America

©2025 Fenopix Privacy Policy Cookies Policy Careers