Home Forums Chart Support Order by Value

Order by Value

Viewing 5 posts - 1 through 5 (of 5 total)
  • #9286

    hi i am getting value from php mysql. is there any option that i can sort the values like 1st value can heigher value. and so on

    echo ” { x: new Date(“.$DDateArr[‘0’].”,”.$DDateArr[‘1’].”,01), y: “.$qq.”},”. PHP_EOL;

    abc = 150
    xyz = 160

    can i order this in this graph ???????
    xyz = 160
    abcd = 150

    Thanks

    #9292

    tufweb,

    Sort feature is not available out of the box. However, with just a few lines of code, you can sort the dataPoint before rendering the chart. Please check out the code snippet below for the same.

    function compareDataPointYAscend(dataPoint1, dataPoint2) {
    		return dataPoint1.y - dataPoint2.y;
    }
    
    chart.options.data[0].dataPoints.sort(compareDataPointYAscend);

    Also, please take a look at this JSFiddle for complete working code.

    Sorting Data Points in Charts

    —-
    Naveen Venugopal
    Team CanvasJS

    #15798

    yes it was very help full for string comparison you can you below code.

    
    function displayGraph(graphData){
    var chart = new CanvasJS.Chart("chartContainer1",graphData);
    	chart.options.data.forEach(function(element) {
        element.dataPoints.sort(compareDataPoint);
    	});
    	chart.render();
    }
    
    function compareDataPoint(dataPoint1, dataPoint2) {
    // instead of label you can also use dataPoint.x  or dataPoint.y depends on you requirment
    	if (dataPoint1.label < dataPoint2.label){return -1}
    	if ( dataPoint1.label > dataPoint2.label){return 1}
    	return 0
    }
    
    
    #32593

    Hi,

    the solution from Saurabh singh works great with a single bar chart.
    But how can we sort a multi series bar chart by the first value?

    Thanks in advance
    best regards, rodolfo

    #32600

    rodolfo,

    To sort the dataPoints for multi-series bar chart, you need to sort the dataPoints for each of data series present in the multi-series bar chart. Please take a look the code snippet below for the same.

    chart.options.data.forEach(function(element) {
       element.dataPoints.sort(compareDataPoint);
    });
    
    function compareDataPoint(dataPoint1, dataPoint2) {
      // instead of label you can also use dataPoint.x  or dataPoint.y depends on you requirment
      if (dataPoint1.label < dataPoint2.label){return -1}
      if ( dataPoint1.label > dataPoint2.label){return 1}
    
      return 0
    }

    Also, check out this JSFiddle for the complete working code.
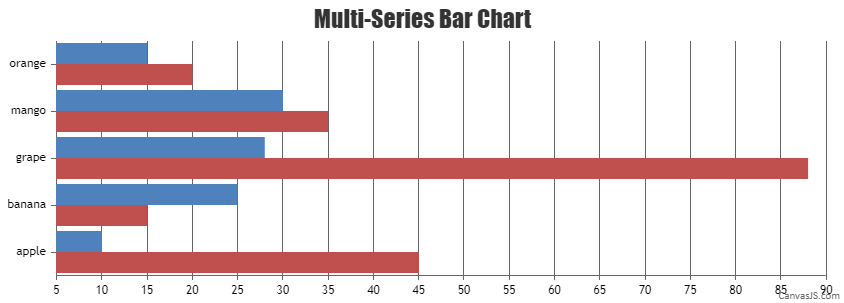
    Sorting Data Points in Multi-Series Bar Charts

    If you are still facing the issue, can you kindly create JSFiddle reproducing the issue you are facing and share it with us along with further briefing so that we can understand your scenario better and help you out?

    —-
    Manoj Mohan
    Team CanvasJS

Viewing 5 posts - 1 through 5 (of 5 total)

You must be logged in to reply to this topic.