Login to Ask a Question or Reply
You must be logged in to post your query.
Home › Forums › Chart Support › Multiple charts from one JSON result
Multiple charts from one JSON result
- This topic has 4 replies, 4 voices, and was last updated 7 years, 11 months ago by
Priyanka M S.
Tagged: JSON, Multiple series, mysql, php
-
February 27, 2015 at 5:31 pm #8276
Hi there!
After struggeling with Google Charts, I would like to thank you for this great, flexible and easy to use chart library. But I have one question regarding JSON data. I have a JSON result from this query:
$data_points = array();
while($row = mysql_fetch_assoc($result)){
$point = array(“label” => $row[‘timeStamp’] , “y” => $row[‘temp’], “y2” => $row[‘hum’]);array_push($data_points, $point);
}
echo json_encode($data_points, JSON_NUMERIC_CHECK);with this structure:
[{“label”:”2015-02-27 09:54:50″,”y”:17.1,”y2″:35.2},{“label”:”2015-02-27 09:59:52″,”y”:17,”y2″:36.4},{“label”:”2015-02-27 10:01:33″,”y”:17,”y2″:36.5},{“label”:”2015-02-27 10:08:16″,”y”:17,”y2″:35.7}]
How can I create two charts, one with label + y as values and one with label + y2 as values or one multiple series chart with both y values from this JSON result?
Best regards,
WillibaldMarch 2, 2015 at 3:35 pm #8279[Update]
Now we have a Tutorial on Creating Charts from JSON Data in our documentation.
willibald,
After getting Json result, create a HTML page that does AJAX request and fetch the data. After getting the data, it will render a Chart.
Below is the sample code:
<html>
<head>
<script type="text/javascript" src="https://canvasjs.com/assets/script/jquery-1.11.1.min.js"></script>
<script type="text/javascript" src="https://cdn.canvasjs.com/canvasjs.min.js"></script>
<script type="text/javascript">
 $(document).ready(function () {

	var dataPointsTemp = [];
	var dataPointsHumidity = [];

// Ajax request for getting JSON data

	$.getJSON("data.json", function(data) {
		for( var i = 0; i < data.length; i++) {
			dataPointsTemp.push({ label: data[i].label, y: data[i].y });
			dataPointsHumidity.push({ label: data[i].label, y: data[i].y2 });
		}

		// Chart with label + y values

		var chart = new CanvasJS.Chart("chartContainer1",
		{
			title:{
				text: "Chart with y value"
			},
			data: [
			{
				dataPoints: dataPointsTemp
			}]
		});
		chart.render();

		// Chart with label + y2 values

		var chart = new CanvasJS.Chart("chartContainer2",
		{
			title:{
				text: "Chart with y2 value"
			},
			data: [
			{
				dataPoints: dataPointsHumidity
			}]
		});
		chart.render();

		// Chart with label + y and y2 values or multiSeries Chart

		var chart = new CanvasJS.Chart("multiChart",
		{
			title:{
				text: "Chart with y and y2 values"
			},
			data: [
			{
				type: "line",
				dataPoints: dataPointsTemp
			},
			{
				type: "line",
				dataPoints: dataPointsHumidity
			}
			]
		});
		chart.render();
	});
});
</script>
<style>
	.chart {
		display: inline-block;
	}
</style>
</head>
<body>
<div id="chartContainer1" class="chart" style="width: 50%; height: 300px;></div>
<div id="chartContainer2" class="chart" style="width: 45%; height: 300px;></div>
<div id="multiChart" style="width: 80%; height: 300px;margin:auto;></div>
</body>
</html>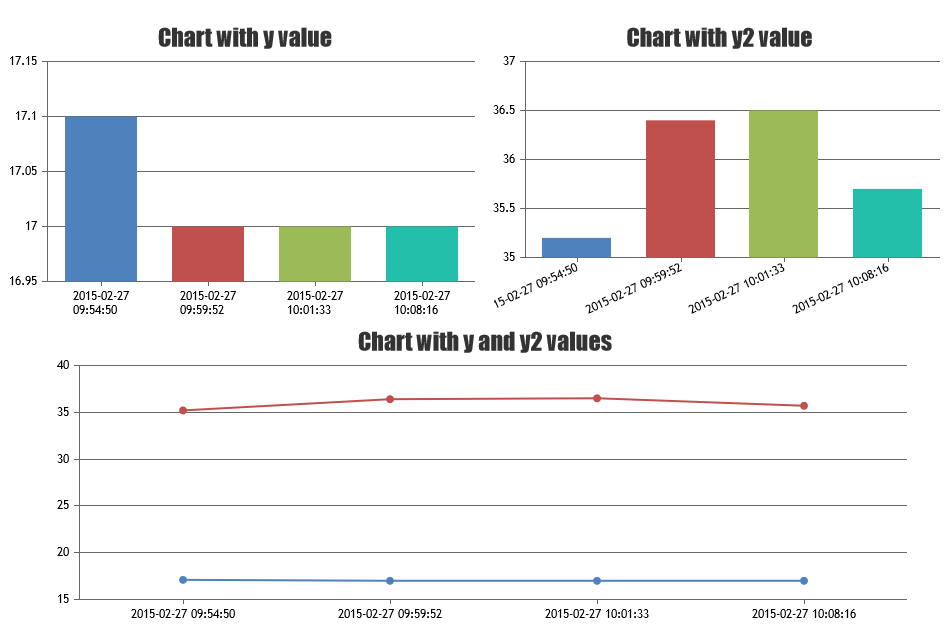
__
AnjaliMarch 2, 2015 at 5:43 pm #8280Dear Anjali,
thank you very much for this detailed explanation and your brilliant work in general. It helped me a lot.
Kind regards from Germany,
MarkusJuly 16, 2018 at 3:47 pm #21842Hi there!
How can I render 2 line chart every second with my code.<script type="text/javascript"> window.onload = function () { var dps1 = []; var dps2 = []; var chart = new CanvasJS.Chart("chartContainer", { toolTip:{ shared: true, }, data: [ { type: "line", dataPoints: dps1 }, { type: "area", dataPoints: dps2 } ] }); $.getJSON("data_1.php", function (data) { for( var i = 0; i < data.length; i++) { dps1.push({ label: data[i].label, y: data[i].y }); dps2.push({ label: data[i].label, y: data[i].y2 }); } chart.options.data[0].dataPoints = data; chart.render(); }); var updateChart = function() { $.getJSON("data_1.php", function (data) { chart.options.data[0].dataPoints = data; chart.render(); }); } setInterval(function(){updateChart()},1000); } </script>July 16, 2018 at 6:32 pm #21848Can you kindly create and share a jsfiddle along with sample data, so that we can look into your code, understand your scenario better and help you out?
__
Priyanka M S
Team CanvasJS
Tagged: JSON, Multiple series, mysql, php
You must be logged in to reply to this topic.