Hi,
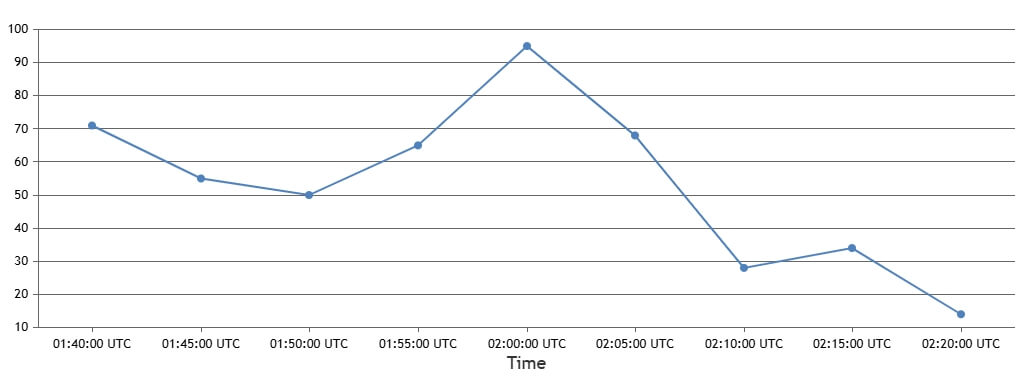
I’m using CanvasJS to display a time series chart where all my data is in UTC. Here’s a simplified example:
dataPoints: [
  { x: new Date("2025-03-30T01:40Z"), y: 50 }
]
However, when the chart renders, the x-axis time label shows a shifted time, based on the user’s local timezone (e.g., 04:40 instead of 01:40). This becomes especially problematic around daylight saving time changes, like March 30.
Is there a built-in way in CanvasJS to force the x-axis to treat date/timestamps as UTC (for both positioning and labeling)? Or is using timestamp + manual formatting the only way?
Thank you!
