@diano4ka,
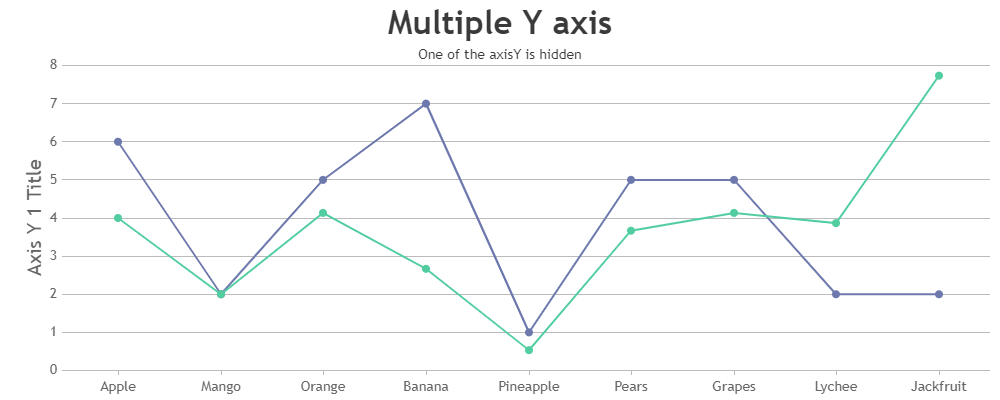
To hide the axis line and tick you can set the lineThickness and tickLength to 0, as shown in the code snippet below.
axisY: {
  tickLength: 0,
  lineThickness: 0,
  labelFormatter: function(){
     return " ";
  }
}
Also, kindly take a look at this JSFiddle for a working sample of the same.

__
Sachin Bisht
Team CanvasJS