Home Forums Chart Support Is it possible to hide the axisY?

Is it possible to hide the axisY?

Viewing 2 posts - 1 through 2 (of 2 total)
  • #45680

    Is it possible to hide the y axis?
    Maybe there is a visible property with switching true/false…
    I have a lot of y axes and they take up a lot of space in width. I need the ability to hide some of the axes, but still have data on the graph.
    https://go.screenpal.com/watch/cZjQQgV9oAF

    #45688

    @diano4ka,

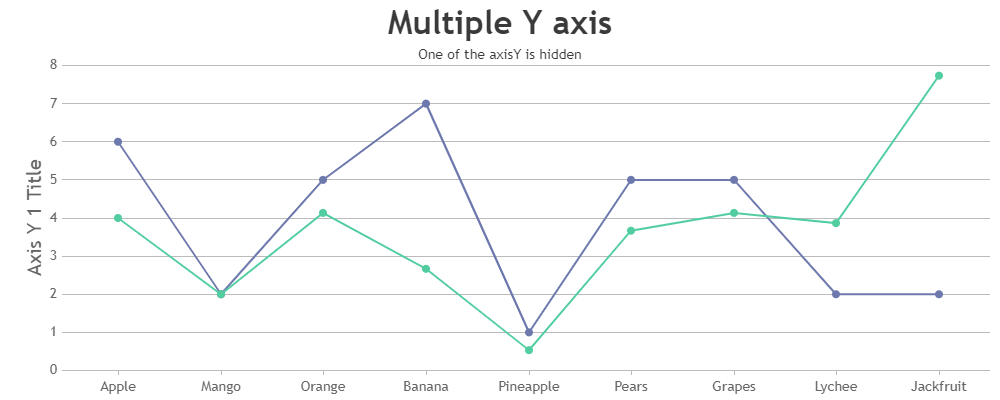
    To hide the axis line and tick you can set the lineThickness and tickLength to 0, as shown in the code snippet below.

    axisY: {
      tickLength: 0,
      lineThickness: 0,
      labelFormatter: function(){
         return " ";
      }  
    }

    Also, kindly take a look at this JSFiddle for a working sample of the same.

    chart with hidden axis in multiple axis

    __
    Sachin Bisht
    Team CanvasJS

Viewing 2 posts - 1 through 2 (of 2 total)

You must be logged in to reply to this topic.