Home Forums Chart Support Log-log chart axis label format as 10 to exponent

Log-log chart axis label format as 10 to exponent

Viewing 5 posts - 1 through 5 (of 5 total)
  • #44620

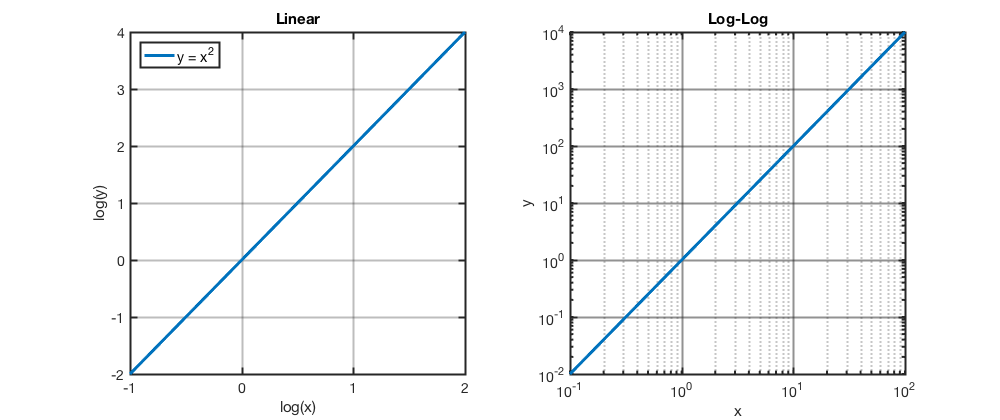
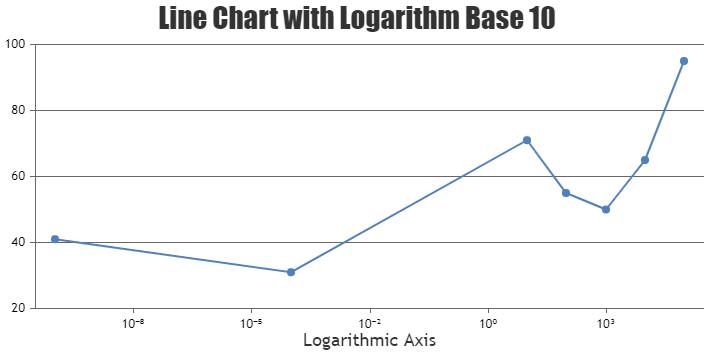
    Hello, I’m creating a log-log chart and would like both the x and y axis to have labels displayed as 10 to some power. See the right image below which shows a sample log plot. As can be seen, it can go negative and positive. How do I replicate axis labels like that?
    log

    #44624

    This solution seems to work ok: https://canvasjs.com/forums/topic/logarithmic-function/

    If there’s a better way to do it nowadays, I’d be glad to see.

    Thanks!

    #44632

    @joshuasosa,

    You can show axis labels in exponential form with the help of unicode characters as mentioned in this thread. Please take a look at this JSFiddle for an example.

    Display negative power values in x-Axis labels

    —-
    Manoj Mohan
    Team CanvasJS

    #45124

    I was having trouble with subscriptValue producing 10^0 for 0.1 in some cases when it should be 10^-1.

    subscriptValue using Math.log10(value) fixes the issue for me, instead of Math.ceil(Math.log(value)/Math.log(10))

    #45131

    @joshuasosa,

    Glad the you were able to figure it out based on your scenario :)

    —-
    Manoj Mohan
    Team CanvasJS

Viewing 5 posts - 1 through 5 (of 5 total)

You must be logged in to reply to this topic.