Login to Ask a Question or Reply
You must be logged in to post your query.
Home › Forums › StockChart Support › weekends showing to charts
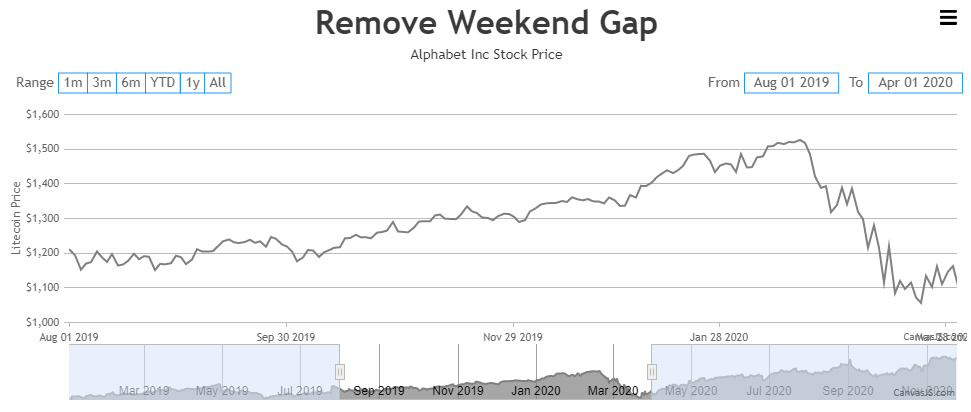
weekends showing to charts
- This topic has 8 replies, 3 voices, and was last updated 3 years, 7 months ago by
Thangaraj Raman.
-
September 28, 2022 at 8:44 pm #39216
The stockcharts are sold as a viable option for displaying stock data.
However, the weekends show on the graphs as gaps which doesn’t make sense at all.
We are not passing in weekend data into the array for the charts however the charts still show that date on the x axis and it shows a gap.
Completely unusable by any serious trader.
Please adviseThanks
September 29, 2022 at 6:54 pm #39228You can use customBreaks for removing weekend gap from the chart. With the use of scale breaks, there are possibilities that the axis labels may appear at an unequal interval and they may overlap with each other. You can overcome this by using stripLines for labels.
Please take a look at this JSFiddle for an example on the same.
—
Thangaraj Raman
Team CanvasJSOctober 2, 2022 at 5:10 pm #39243When I try this example then I get this error.
What am I doing wrong?Cannot set properties of undefined (‘custombreaks’)
Thank you
October 3, 2022 at 9:55 am #39245The JSFiddle shared seems to be working fine without any error. Based on the error that you are getting, you might be passing it as ‘custombreaks’ instead of ‘customBreaks’. All the chart properties are case-sensitive. Hence passing it as customBreaks should work fine. Please refer documentation page for more information & live-examples.
If you are still facing issue, kindly create JSFiddle reproducing the issue you are facing & share it with us. From what we have observed, sometimes things get delayed mostly when we are not able to reproduce the issue at our end or not able to understand the exact requirements or due to the variation in chart-options being used by you and us. Because of these reasons we expect you so share JSFiddle along with sample data which helps us run it at our end to understand the use case and help you resolve.
—
Vishwas R
Team CanvasJSOctober 4, 2022 at 11:39 pm #39288hi
I have used the example you provided (which uses a line chart) on my candlestick chart
I have copied the code but see different results in that the navigator view still shows the weekend gaps whereas the main chart is now fine.
Why is this happening?Thank you
I can’t see to add the image or link to this post – everytime I try to add a google drive link of the screen sot then it fails to post the response.
October 4, 2022 at 11:51 pm #39289Actually to get around this, have converted the navigator to line instead candlesticks and that hides the gaps :-)
Thanks!October 6, 2022 at 6:26 pm #39299Glad that you were able to make it work. If you have any further queries or facing any other issues, kindly create a JSFiddle with your use case and share it with us so that we can look into the code / chart-options being used, understand the scenario better and help you out.
—
Thangaraj Raman
Team CanvasJSOctober 11, 2022 at 9:35 am #39285October 11, 2022 at 6:03 pm #39335Can you kindly create JSFiddle reproducing the issue you are facing & share it with us so that we can look into the code / chart-options being used, understand the scenario better and help you out?
From what we have observed, sometimes things get delayed mostly when we are not able to reproduce the issue or not able to understand the exact scenario, or the solution that we provide may not work properly due to the variation in chart options being used by you and us.
Having a JSFiddle helps us in figuring out the issue and suggesting an appropriate solution accordingly.
—
Thangaraj Raman
Team CanvasJS
You must be logged in to reply to this topic.