Home Forums Chart Support Need charts having ranges instead of number

Need charts having ranges instead of number

Viewing 4 posts - 1 through 4 (of 4 total)
  • #38386

    FG

    I need to create a chart in which I want to display chart in following way:
    X-Axis:
    – Banglore
    – Mumbai
    – chennai
    Y-Axis:
    – 10-20
    – 20-30
    – 30-40
    Is it possible to display bar chart or any chart in such manner?

    #38398

    @fg,

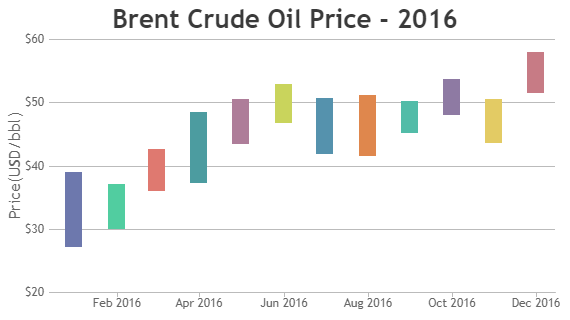
    You can use Range Charts like Range Column Chart, Range Area Chart, etc. in this scenario. Please check out gallery for more examples along with source code.
    JavaScript Range Column Chart


    Vishwas R
    Team CanvasJS

    #38522

    FG

    @vishwas R

    Cant we use that in Normal Bar chart.

    #38535

    @fg,

    Bar / Column chart accepts 1 y-value & starts rendering bar from the baseline (zero). To pass y-values as a range, you can use range bar / range column chart. Kindly check out our gallery for live examples along with source-code.


    Vishwas R
    Team CanvasJS

Viewing 4 posts - 1 through 4 (of 4 total)

You must be logged in to reply to this topic.