@kfox,
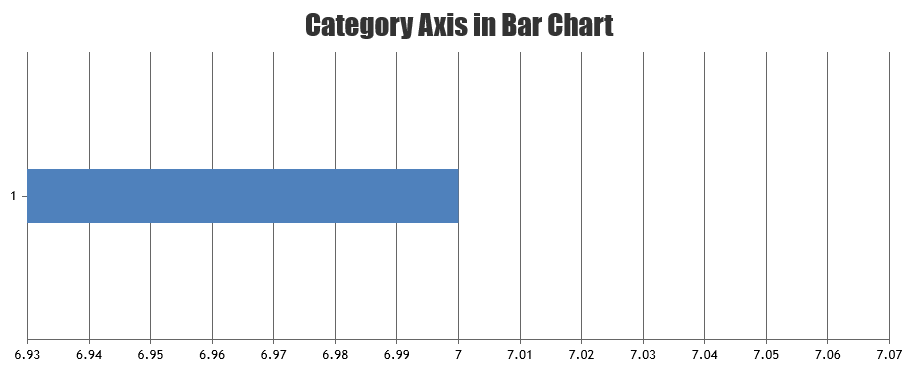
In case of numeric axis chart, labels will be shown at every interval of the axis. Because of this, it’s showing 1 & -1. If there is just one datapoint and your requirement is to show label just for datapoint, you can use category axis (use label instead of x-value). Please take a look at this JSFiddle for an example.
Considering this as duplicate of Single data row barcharts showing 1, -1 rows, hence closing the same.
—
Vishwas R
Team CanvasJS