Home Forums Chart Support Show timeseries interpolated value in tooltip

Show timeseries interpolated value in tooltip

Viewing 4 posts - 1 through 4 (of 4 total)
  • #37409

    Dear support team,

    Is there a way to show/display timeseries interpolated value in tooltip?
    e.g. https://jsfiddle.net/b5wmLoyp/2/
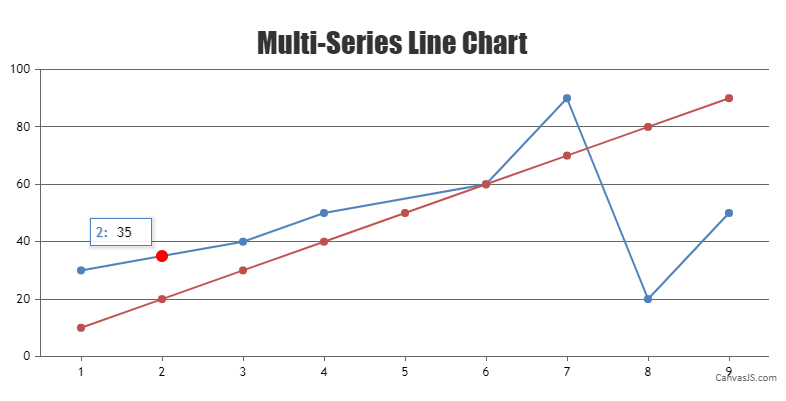
    In jsfiddle, point 1 and 3 has middle point 2 being intepolated and its value is 35. How to display 35 at point 2 in tooltip?

    Thanks!

    #37449

    @cancanvas,

    You can use the linear interpolation formula to find a point on a straight line. This interpolated value (y = y1 + ((x – x1) / (x2 – x1)) * (y2 – y1)) can be added to your dataSeries to display the toolTip.

    Kindly take a look at this updated JSFiddle for an example on the same.

    chart with data calculated using linear interpolation formula


    Adithya Menon
    Team CanvasJS

    #37452

    Hi Adithya,

    Thanks for the quick response. Is it possible to just show as tooltip without physically adding the interpolated data point? All I need is to show interpolated data in a tooltip.

    Thanks!

    #37469

    @cancanvas,

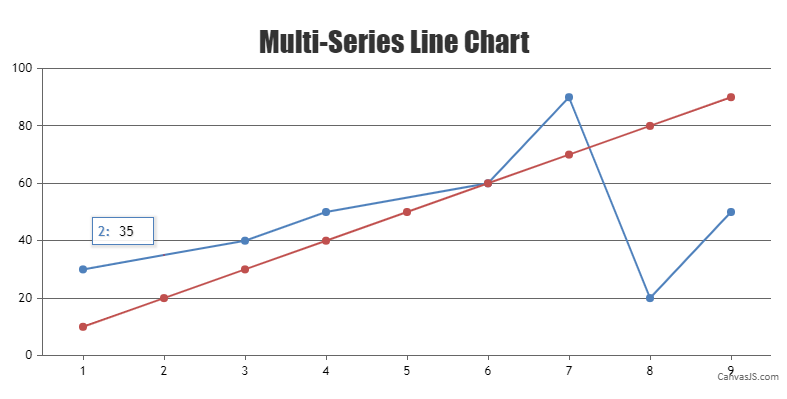
    In order to show the toolTip for the interpolated dataPoint, you will have to add the dataPoint to the dataSeries. However, you can hide the dataPoint by setting the markerSize property to 1 and highlightEnabled property to false.

    Kindly take a look at this updated JSFiddle for an example on the same.

    chart with a hidden data point calculated using linear interpolation formula


    Adithya Menon
    Team CanvasJS

Viewing 4 posts - 1 through 4 (of 4 total)

You must be logged in to reply to this topic.