@keval-panchal,
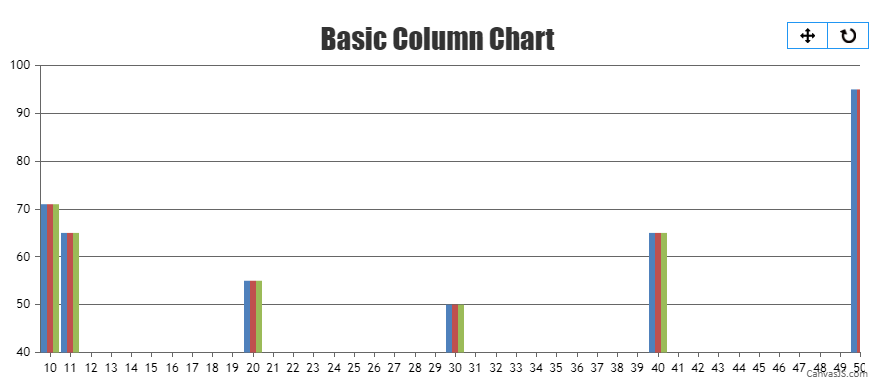
The dataPointWidth is auto calculated such that no column is overlapped in case of a single series or multi-series chart. In your case, you are setting the dataPointWidth manually which makes the columns overlap with each other.
Please take a look at this updated JSFiddle for a working example.
Considering this thread as a duplicate of Bar Chart Overlapping Issue and hence closing the same.
—
Thangaraj Raman
Team CanvasJS