Login to Ask a Question or Reply
Home › Forums › Chart Support › About CSV data series graph › Reply To: About CSV data series graph
November 3, 2021 at 7:36 pm
#36200
Lakshmi Venkatappa,
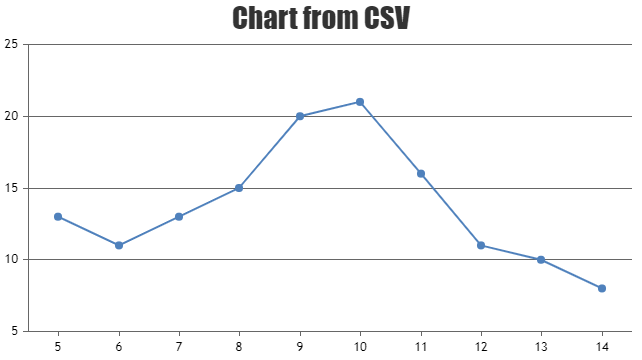
To create a chart from CSV, you will have to get the CSV data using AJAX call and convert the same to CanvasJS supported format. Please check this documentation page for a step-by-step tutorial on the same.
The sample data that you have provided seems to be in JSON format. If you are looking to render a chart from JSON data please check this documentation page for a tutorial. However, if you are still facing issues in rendering the chart please share your sample data(CSV or JSON file) over Google-Drive or OneDrive so that we can analyze your data and help you out.
—
Thangaraj Raman
Team CanvasJS