Login to Ask a Question or Reply
Home › Forums › Chart Support › Drag graph and update y axis interval dynamically › Reply To: Drag graph and update y axis interval dynamically
October 11, 2021 at 6:25 pm
#36003
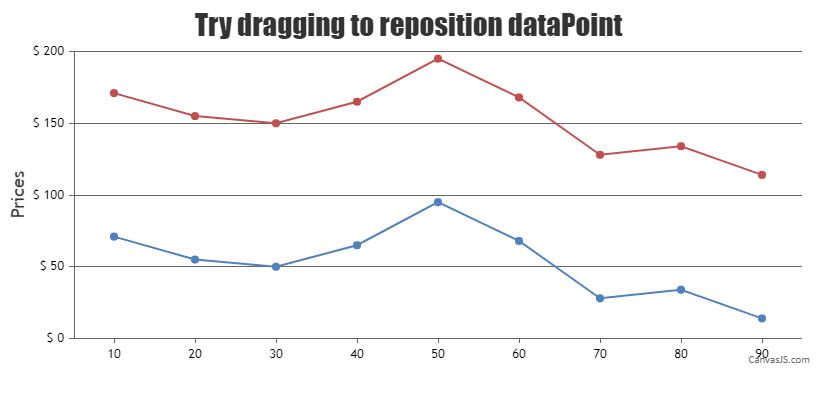
To move the entire line by clicking on the dataPoint, you will have to change the position of dataPoint by adding / subtracting a value indicated by the mouse position with the dataPoint’s value, along with it, you will also have to add / subtract the same value to the entire dataSeries as shown in the code-snippet below,
for(var i = 0; i < chart.options.data[selectedDataSeries].dataPoints.length; i++) {
            if(chart.options.data[selectedDataSeries].dataPoints[i] !== chart.data[selectedDataSeries].dataPoints[selectedDataPoint]) {
              chart.options.data[selectedDataSeries].dataPoints[i].y = chart.options.data[selectedDataSeries].dataPoints[i].y + yValueDifference;
   }
}
Kindly take a look at this JSFiddle for an example on repositioning the entire dataSeries by dragging a single dataPoint.
—
Team CanvasJS
Adithya Menon