@jobinvcm,
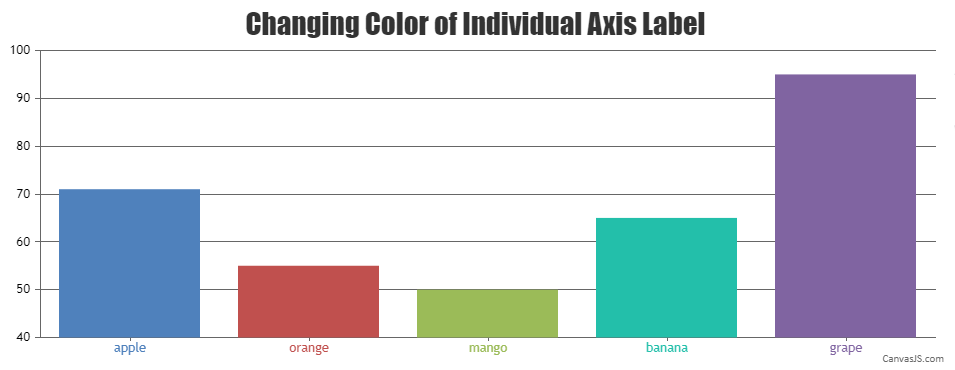
Setting font color of individual axis labels is not possible as of now. However, you can replace axis label with stripline label and set the color of each individual label using labelFontColor property as shown in the code snippet below –
function changeAxisLabelColor(chart) {
    var dps;
    for(var i = 0; i < chart.data[0].dataPoints.length; i++){
        dps = chart.data[0].dataPoints[i];
        if(dps.labelFontColor)
            chart.axisX[0].addTo("stripLines", { value: dps.x, label: dps.label, labelPlacement: "outside", labelBackgroundColor: "white", color: "transparent", labelFontColor: dps.labelFontColor });
    }
}
Please take a look at this JSFiddle for complete working code.
___________
Indranil Deo
Team CanvasJS
.