Login to Ask a Question or Reply
Home › Forums › Chart Support › Need help in creating BAR CHART in angular › Reply To: Need help in creating BAR CHART in angular
May 11, 2021 at 7:24 pm
#34303
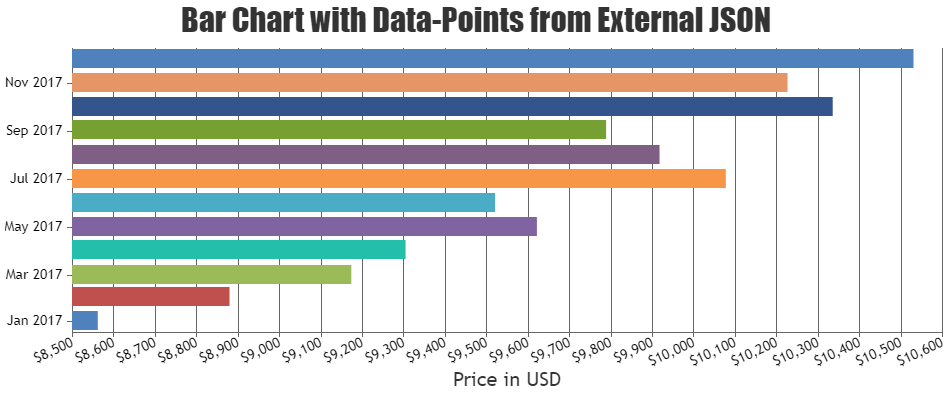
To create chart from JSON data you need to loop through the JSON source and parse it to the format accepted by CanvasJS as shown in the code snippet below –
$.getJSON("https://api.npoint.io/15a2e36f801cc544c90b", function(data) {
  $.each(data, function(key, value){
    dataPoints.push({x: data[key].x, y: parseInt(data[key].y)});
  });
  chart.render();
});
Please take a look at this documentation page for step to step instruction on rendering chart from JSON data. Also, kindly check this StackBlitz example for complete code on rendering chart from JSON data in Angular.

___________
Indranil Deo
Team CanvasJS