You must be logged in to post your query.
Home › Forums › Chart Support › Y-Axis label for baseline is hidden when using axisY.minimum
Tagged: yaxis minimum label bug
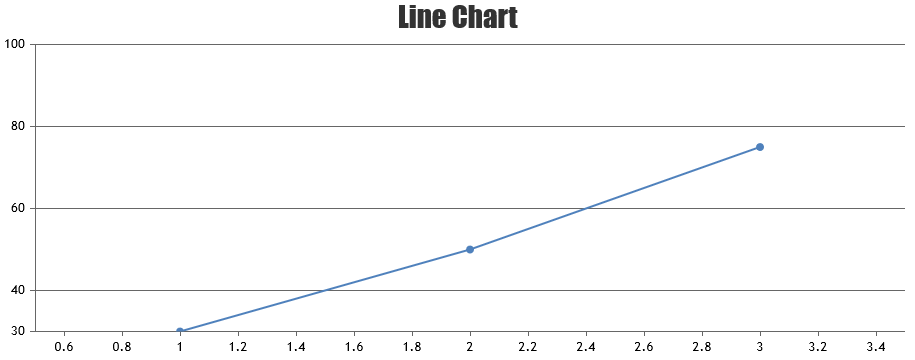
I have a chart (JSFiddle) where I manually set the minimum value of the Y-Axis, however the label for the baseline Y-Axis is empty, when it should be displaying 30.
I noticed that the baseline y-axis label always appears to be empty, UNLESS I set the y-axis minimum to be a number that is a multiple of the interval that’s calculated under the hood.
e.g. if CanvasJS computes the interval internally to be 20, and I set the y-axis minimum to 20/40/60/etc it shows a value. If I set the y-axis minimum to any other number the label appears blank.
Is there a workaround to have this value show up? If not then this should be prioritized as a bug to fix since it’s critical to our product, thanks!
@agaur,
Label are shown at a value which is multiple of interval. To show label at the bottom of y-axis, you can add a stripline & set it’s label-placement to outside. Below is the code snippet showing the same.
var axisY = chart.axisY; axisY.addTo("stripLines", { value: axisY.viewportMinimum, label: axisY.viewportMinimum, labelPlacement: "outside", labelFontColor: axisY.labelFontColor, color: axisY.tickColor, labelBackgroundColor: chart.backgroundColor, thickness: 0 });
Please take a look at this JSFiddle for complete code.
— Vishwas R Team CanvasJS
You must be logged in to reply to this topic. Login/Register