Login to Ask a Question or Reply
You must be logged in to post your query.
Home › Forums › Chart Support › chart with data from json
chart with data from json
- This topic has 5 replies, 2 voices, and was last updated 5 years, 5 months ago by
Manoj Mohan.
-
October 30, 2020 at 11:18 pm #31813
Dear all,
in your example “JavaScript Charts from JSON Data API and AJAX” you plot the chart from a json format [[1,11],[2,11],[3,14],[4,10],…..] and all sound good, but I have a json with this format [37.007,37.503,37.878,37.503,37.128,36.258,36.875,37.25,37.503,39.882,……]
please could you help me how to change the code to plot these numbers.
Thank you for your support, best regards
NicolaNovember 2, 2020 at 6:40 pm #31831November 4, 2020 at 5:50 pm #31839Dear Manoj
I tried the code you sent me and it works well but when I modify the link with mine it’s all blank
https://eodhistoricaldata.com/api/eod/MCD.US?api_token=OeAFFmMliFG5orCUuwAKQ8l4WWFQ67YX&fmt=json&filter=close&period=d.
And if the json data are not filtered by close like
https://eodhistoricaldata.com/api/eod/MCD.US?api_token=OeAFFmMliFG5orCUuwAKQ8l4WWFQ67YX&fmt=json&period=d.
could I use in the line chart “date” for X axis and “adjusted close” for Y axis
Thank you and best regards
NicolaNovember 4, 2020 at 6:47 pm #31849Nicola,
I tried the code you sent me and it works well but when I modify the link with mine it’s all blank
For security reasons, browsers restrict cross-origin requests. To access JSON from a different domain, you can refer to JSONP.
And if the json data are not filtered by close like
https://eodhistoricaldata.com/api/eod/MCD.US?api_token=OeAFFmMliFG5orCUuwAKQ8l4WWFQ67YX&fmt=json&period=d.
could I use in the line chart “date” for X axis and “adjusted close” for Y axisYou can parse the JSON and pass “date” and “adjusted_close” values as x and y in dataPoints as shown in this JSFiddle.
—-
Manoj Mohan
Team CanvasJSFebruary 16, 2021 at 11:31 pm #32810Dear Canvas
I use data from JSON to plot a line chart, here the link with the data
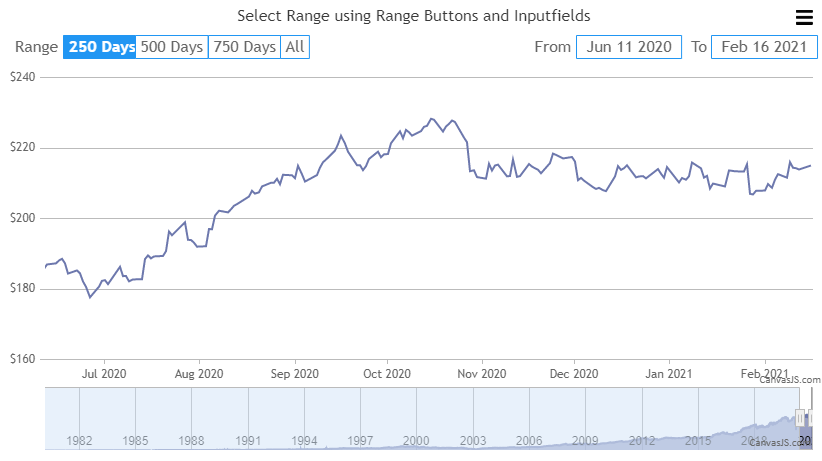
I use only the DATE for X and the ADJUSTED_CLOSE for Y, is it possible to plot only the last 250 data but have the possibility on the chart to select to plot the last 500 or 750 or 1000 data? or from date to date?
Thank you and best regards
Nicola Presa
February 17, 2021 at 8:48 pm #32820Nicola Presa,
Based on the data you have shared above and considering your requirement, using CanvasJS StockChart will suit your scenario. It comes with built-in features like inputfields and range buttons using which you can select a specific range that is needed to be displayed in the viewport. Selecting the last 250, 500 or 750 days can be achieved using custom range buttons for which you can define the range and rangeType property as shown in the below code snippet.
buttons: [
      {
        label: "250 Days",
        range: 250,
        rangeType: "day"
      },
      {
        label: "500 Days",
        range: 500,
        rangeType: "day"
      },
      {
        label: "750 Days",
        range: 750,
        rangeType: "day"
      },
      {
        label: "All",
        rangeType: "all"
      }
]
Also, for selecting precise date range (data to date range), you can use inputFields. Please take a look at this JSFiddle for an example.
—-
Manoj Mohan
Team CanvasJS
You must be logged in to reply to this topic.