Home Forums Chart Support loop the graph

loop the graph

Viewing 2 posts - 1 through 2 (of 2 total)
  • #23113

    Hi, I want to loop the graph.
    for example when user insert 4 in input text, then 4 graph will display.
    I have done the for loop but unfortunately my graph did not display.
    here is my file in Google drive
    https://drive.google.com/file/d/1kKwTSvRRj0dQubdlNM0ahfqAEZyZvRG7/view?usp=sharing

    thank you

    #23139

    @stella,

    You will need to create chart containers(div) dynamically in order to render multiple charts in a page as shown in the code snippet below:

    var noOfCharts = 4;
    var charts =[];
    
    var chartOptions = {
        data: [
          {
            type: "column",
            dataPoints: [
              { x: 10, y: 71 },
              { x: 20, y: 55 },
              { x: 30, y: 50 },
              { x: 40, y: 65 },
              { x: 50, y: 95 },
              { x: 60, y: 68 },
              { x: 70, y: 28 },
              { x: 80, y: 34 },
              { x: 90, y: 14 }
            ]
          }					
        ]
      };
      
    for(var i = 0; i < noOfCharts; i++) {
      var chartDiv = document.createElement('div');
      chartDiv.setAttribute('id', 'chartContainer' + i);
      chartDiv.style.cssText = 'height: 300px; width: 100%;';
      document.getElementsByTagName('body')[0].appendChild(chartDiv);
    
      chartOptions.title = { text: "Chart " + (i+1)};
      charts[i] = new CanvasJS.Chart(chartDiv.id, chartOptions);	
      charts[i].render();  
    }

    Please take a look at this JSFiddle for a working example with sample code.
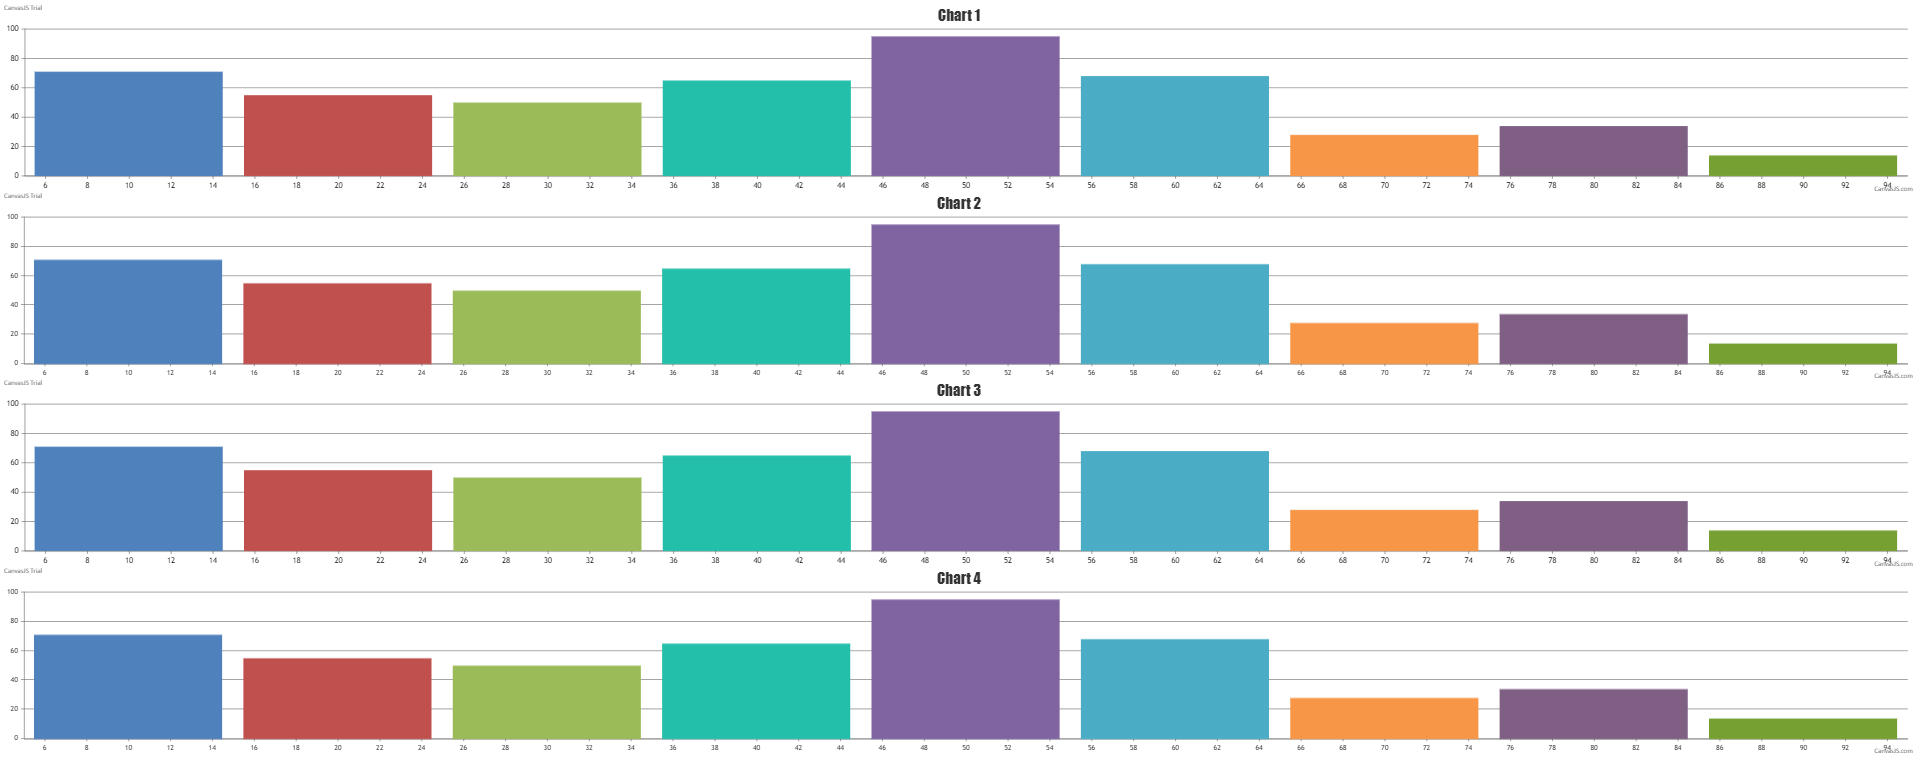
    CanvasJS rendering multiple charts in a page dynamically

    __
    Priyanka M S
    Team CanvasJS

Viewing 2 posts - 1 through 2 (of 2 total)

You must be logged in to reply to this topic.