Lightweight, Beautiful & Responsive Charts that makes your dashboards fly even with millions of data points!
30+ Chart Types
Supports Real-time Analytics
Renders across Devices & Platforms
Multi-Language Support
Self-Hosted, Secure & Scalable
World’s best companies use CanvasJS to Visualize their Data
Trusted by 500K+ Users in 192 Countries.
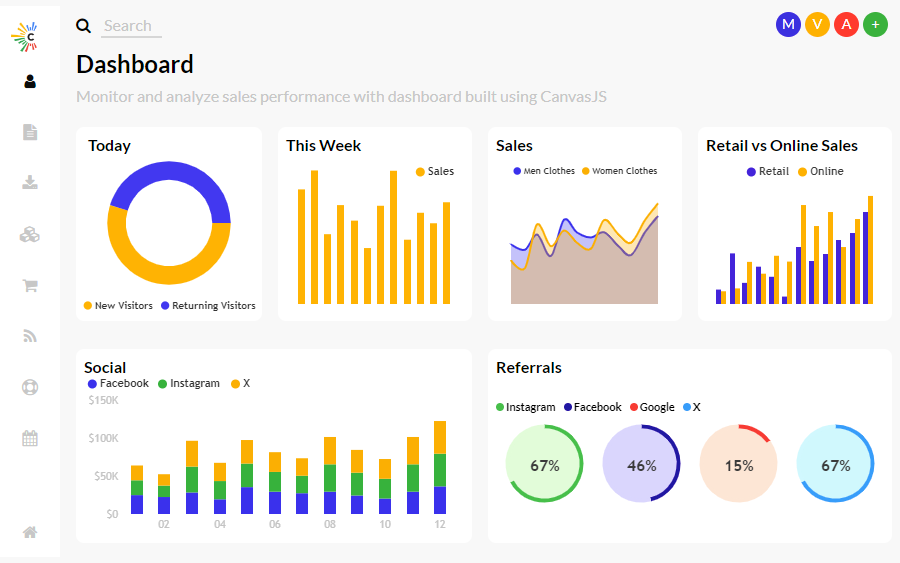
High Performance Data Visualization Matters!
CanvasJS offers fast, powerful and easy to use data visualization components. Even real-time analytics dashboards render across devices without flickering or delays!
Time To Render:
Google Cloud + CanvasJS Solution Architecture
Our HTML5 Charts work with all the popular Libraries & Frameworks like React, Angular, jQuery, ASP.Net, PHP, Node.JS, etc. Click on any technology for samples.