Login to Ask a Question or Reply
Home › Forums › Chart Support › MySQL – (Displaying Date-Time values on a Chart Axis) › Reply To: MySQL – (Displaying Date-Time values on a Chart Axis)
July 25, 2018 at 12:28 pm
#21961
JohnSnowGum,
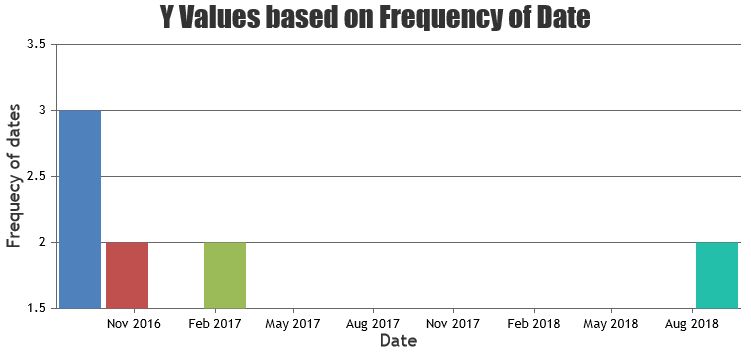
You can calculate the frequency the date-occurrences in the data & build a set of datapoints. Please refer the code-snippet below.
function calculateFrequency(dateArray) {
  dateArray.sort();
  var currentXValue = null;
  var count = 0;

  for (var i = 0; i < dateArray.length; i++) {
    if (dateArray[i] != currentXValue) {
      if (count > 0)
        dps.push({x: new Date(currentXValue), y: count});
      currentXValue = dateArray[i];
      count = 1;
    } else {
      count++;
    }
  }
  if (count > 0)
    dps.push({x: new Date(currentXValue), y: count});
}
Please take a look at this JSFiddle for complete code. This example reads data from an array instead of database.
__
Priyanka M S
Team CanvasJS